Main Content

idnlarx

Nonlinear ARX model

Description

An idnlarx model represents a nonlinear ARX model, which is an extension of the linear ARX structure and contains linear and nonlinear functions.

A nonlinear ARX model consists of model regressors and an output function. The output function contains one or more mapping objects, one for each model output. Each mapping object can include a linear and a nonlinear function that act on the model regressors to give the model output and a fixed offset for that output. This block diagram represents the structure of a single-output nonlinear ARX model in a simulation scenario.

Regressor block is on the left. Output function is on the right. Output function block contains, from top to bottom, Offset, Nonlinear Function, and Linear Function. The inputs to the Regressor block are system input u and the output of the output function y.

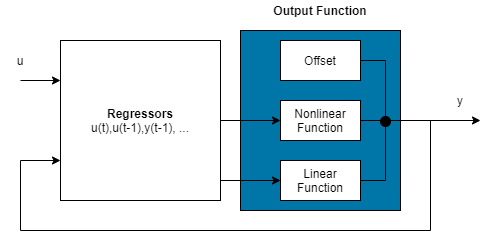
The software computes the nonlinear ARX model output y in two stages:

  1. It computes regressor values from the current and past input values and the past output data.

    In the simplest case, regressors are delayed inputs and outputs, such as u(t–1) and y(t–3). These kind of regressors are called linear regressors. You specify linear regressors using the linearRegressor object. You can also specify linear regressors by using linear ARX model orders as an input argument. For more information, see Nonlinear ARX Model Orders and Delay. However, this second approach constrains your regressor set to linear regressors with consecutive delays. To create polynomial regressors, use the polynomialRegressor object. To create periodic regressors that contain the sine and cosine functions of delayed input and output variables , use the periodicRegressor object. You can also specify custom regressors, which are nonlinear functions of delayed inputs and outputs. For example, u(t–1)y(t–3) is a custom regressor that multiplies instances of input and output together. Specify custom regressors using the customRegressor object.

    You can assign any of the regressors as inputs to the linear function block of the output function, the nonlinear function block, or both.

  2. It maps the regressors to the model output using an output function block. The output function block can include multiple mapping objects, with each mapping object containing linear, nonlinear, and offset blocks in parallel. For example, consider the following equation:

    F(x)=LT(xr)+g(Q(xr))+d

    Here, x is a vector of the regressors, and r is the mean of x. F(x)=LT(xr)+y0 is the output of the linear function block. g(Q(xr))+y0 represents the output of the nonlinear function block. Q is a projection matrix that makes the calculations well-conditioned. d is a scalar offset that is added to the combined outputs of the linear and nonlinear blocks. The exact form of F(x) depends on your choice of output function. You can select from the available mapping objects, such as tree-partition networks, wavelet networks, and multilayer neural networks. You can also exclude either the linear or the nonlinear function block from the output function.

    When estimating a nonlinear ARX model, the software computes the model parameter values, such as L, r, d, Q, and other parameters specifying g.

The resulting nonlinear ARX models are idnlarx objects that store all model data, including model regressors and parameters of the output function. For more information about these objects, see Nonlinear Model Structures.

For more information on the idnlarx model structure, see What are Nonlinear ARX Models?.

For idnlarx object properties, see Properties.

Creation

You can obtain an idnlarx object in one of two ways.

  • Use the nlarx command to both construct an idnlarx object and estimate the model parameters.

    sys = nlarx(data,reg)

  • Use the idnlarx constructor to create the nonlinear ARX model and then estimate the model parameters using nlarx or pem.

    sys = idnlarx(output_name,input_name,reg)

Description

Specify Model Directly

example

sys = idnlarx(output_name,input_name,orders) specifies a set of linear regressors using ARX model orders. Use this syntax when you extend an ARX linear model, or when you plan to use only regressors that are linear with consecutive lags.

example

sys = idnlarx(output_name,input_name,Regressors) creates a nonlinear ARX model with the output and input names of output_name and input_name, respectively, and a regressor set in Regressors that contains any combination of linear, polynomial, periodic, and custom regressors. The software constructs sys using the default wavelet network ('idWaveletNetwork') mapping object for the output function.

example

sys = idnlarx(___,OutputFcn) specifies the output function OutputFcn that maps the regressors to the model output. You can use this syntax with any of the previous input argument combinations.

Initialize Model Values Using Linear Model

example

sys = idnlarx(linmodel) uses a linear model linmodel to extract certain properties such as names, units, and sample time, and to initialize the values of the linear coefficients of the model. Use this syntax when you want to create a nonlinear ARX model as an extension of, or an improvement upon, an existing linear model.

example

sys = idnlarx(linmodel,OutputFcn) specifies the output function OutputFcn that maps the regressors to the model output.

Specify Model Properties

sys = idnlarx(___,Name,Value) specifies additional properties of the idnlarx model structure using one or more name-value arguments.

Input Arguments

expand all

ARX model orders, specified as the matrix [na nb nk]. na denotes the number of delayed outputs, nb denotes the number of delayed inputs, and nk denotes the minimum input delay. The minimum output delay is fixed to 1. For more information on how to construct the orders matrix, see arx.

When you specify orders, the software converts the order information into a linear regressor form in the idnlarx Regressors property. For an example, see Create Nonlinear ARX Model Using ARX Model Orders.

Discrete-time identified input/output linear model, specified as any linear model created using estimators, that is, an idpoly object, an idss object, an idtf object, or an idproc object with Ts > 0. Create this model using the constructor function for the object or estimate the model using the associated estimation command. For example, to create an ARX model, use arx, and specify the resulting idpoly object as linmodel.

Properties

expand all

Regressor specification, specified as a column vector containing one or more regressor specification objects, which are the linearRegressor objects, polynomialRegressor objects, periodicRegressor objects, and customRegressor objects. Each object specifies a formula for generating regressors from lagged variables. For example:

  • L = linearRegressor({'y1','u1'},{1,[2 5]}) generates the regressors y1(t–1), u1(t–2), and u2(t–5).

  • P = polynomialRegressor('y2',4:7,2) generates the regressors y2(t–4)2, y2(t–5)2,y2(t–6)2, and y2(t–7)2.

  • SC = periodicRegressor({'y1','u1'},{1,2}) generates the regressors y1(t-1)), cos(y1(t-1)), sin(u1(t-2)), and cos(u1(t-2)).

  • C = customRegressor({'y1','u1','u2'},{1 2 2},@(x,y,z)sin(x.*y+z)) generates the single regressor sin(y1(t–1)u1(t–2)+u2(t–2)

    .

For an example that implements these regressors, see Create and Combine Regressor Types.

To add regressors to an existing model, create a vector of specification objects and use dot notation to set Regressors to this vector. For example, the following code first creates the idnlarx model sys and then adds the regressor objects L, P, SC, and C to the regressors of sys.

sys = idnlarx({'y1','y2'},{'u1','u2'});
R = [L;P;SC;C];
sys.Regressors = R;

For an example of creating and using a linear regressor set, see Create Nonlinear ARX Model Using Linear Regressors.

Output function that maps the regressors of the idnlarx model into the model output, specified as a column array containing zero or more of the following strings or mapping objects:

'idWaveletNetwork' or idWaveletNetwork objectWavelet network
'idLinear' or '' or [] or idLinear objectLinear function
'idSigmoidNetwork' or idSigmoidNetwork objectSigmoid network
'idTreePartition' or idTreePartition objectBinary tree partition regression model
'idGaussianProcess' or idGaussianProcess objectGaussian process regression model (requires Statistics and Machine Learning Toolbox™)
'idTreeEnsemble' or idTreeEnsembleRegression tree ensemble model (requires Statistics and Machine Learning Toolbox)
'idSupportVectorMachine' or idSupportVectorMachineKernel-based Support Vector Machine (SVM) regression model with constraints (requires Statistics and Machine Learning Toolbox)
'idNeuralNetwork' or idNeuralNetwork objectMultilayer neural network (requires Statistics and Machine Learning Toolbox or Deep Learning Toolbox™)
idCustomNetwork objectCustom network — Similar to idSigmoidNetwork, but with a user-defined replacement for the sigmoid function

The idWaveletNetwork, idSigmoidNetwork, idTreePartition, and idCustomNetwork objects contain both linear and nonlinear components. You can remove (not use) the linear components of idWaveletNetwork, idSigmoidNetwork, and idCustomNetwork by setting the LinearFcn.Use value to false.

The idTreeEnsemble and idSupportVectorMachine objects contain only a nonlinear component. The idLinear function, as the name implies, has only a linear component.

Specifying a character vector, for example 'idSigmoidNetwork', creates a mapping object with default settings. Alternatively, you can specify mapping object properties in two other ways:

  • Create the mapping object using arguments to modify default properties.

    MO = idSigmoidNetwork(15)
  • Create a default mapping object first and then use dot notation to modify properties.

    MO = idSigmoidNetwork;
    MO.NumberOfUnits = 15

For ny output channels, you can specify mapping objects individually for each channel by setting OutputFcn to an array of ny mapping objects. For example, the following code specifies OutputFcn using dot notation for a system with two input channels and two output channels.

sys = idnlarx({'y1','y2'},{'u1','u2'});
sys.OutputFcn = [idWaveletNetwork; idSigmoidNetwork]
To specify the same mapping for all outputs, specify OutputFcn as a character vector or a single mapping object.

OutputFcn represents a static mapping function that transforms the regressors of the nonlinear ARX model into the model output. OutputFcn is static because it does not depend on the time. For example, if y(t)=y0+a1y(t1)+a2y(t2)++b1u(t1)+b2u(t2)+, then OutputFcn is a linear function represented by the idLinear object.

For an example of specifying the output function, see Specify Output Function for Nonlinear ARX Model.

Regressor assignments to the linear and nonlinear components of the nonlinear ARX model, specified as an nr-by-nc table with logical entries that specify which regressors to use for which component. Here, nr is the number of regressors. nc is the total number of linear and nonlinear components in OutputFcn. The rows of the table correspond to individual regressors. The row names are set to regressor names. If the table value for row i and component index j is true, then the ith regressor is an input to the linear or nonlinear component j.

For multi-output systems, OutputFcn contains one mapping object for each output. Each mapping object can use both linear and nonlinear components or only one of the two components.

For an example of viewing and modifying the RegressorUsage property, see Modify Regressor Assignments to Output Function Components.

Regressor and output centering and scaling, specified as a structure. As the following table shows, each field in the structure contains a row vector with a length that is equal to the number of either regressors (nr) or model outputs (ny).

FieldDescriptionDefault Element Value
RegressorCenterRow vector of length nrNaN
RegressorScaleRow vector of length nrNaN
OutputCenterRow vector of length nyNaN
OutputScaleRow vector of length nyNaN

For a matrix X, with centering vector C and scaling vector S, the software computes the normalized form of X using Xnorm = (X-C)./S.

The following figure illustrates the normalization flow for a nonlinear ARX model.

Flow diagram for normalization contains, from left to right, regressor formation, regressor normalization, regressor-to-output mapping, and output denormalization.

In this figure:

  1. The algorithm converts the inputs u(t) and y(t) into the regressor set R(t).

  2. The algorithm uses the regressor centering and scaling parameters to normalize R(t) as RN(t).

  3. RN(t) provides the input to the mapping function, which then produces the normalized output yN

  4. The algorithm uses the output scaling and centering parameters to restore the original range, producing y(t).

Typically, the software normalizes the data automatically during model estimation, in accordance with the option settings in nlarxOptions for Normalize and NormalizationOptions. You can also directly assign centering and scaling values by specifying the values in vectors, as described in the previous table. The values that you assign must be real and finite. This approach can be useful, for example, when you are simulating your model using inputs that represent a different operating point from the operating point for the original estimation data. You can assign the values for any field independently. The software will estimate the values of any fields that remain unassigned (NaN).

This property is read-only.

Summary report that contains information about the estimation options and results for a nonlinear ARX model obtained using the nlarx command. Use Report to find estimation information for the identified model, including:

  • Estimation method

  • Estimation options

  • Search termination conditions

  • Estimation data fit

The contents of Report are irrelevant if the model was constructed using idnlarx.

sys = idnlarx('y1','u1',reg);
sys.Report.OptionsUsed
ans =

     []

If you use nlarx to estimate the model, the fields of Report contain information on the estimation data, options, and results.

load iddata1;
sys = nlarx(z1,reg);
m.Report.OptionsUsed
Option set for the nlarx command:

  IterativeWavenet: 'auto'
             Focus: 'prediction'
           Display: 'off'
    Regularization: [1x1 struct]
      SearchMethod: 'auto'
     SearchOptions: [1x1 idoptions.search.identsolver]
      OutputWeight: 'noise'
          Advanced: [1x1 struct]

For more information on this property and how to use it, see Output Arguments in the nlarx reference page and Estimation Report.

Independent variable for the inputs, outputs, and—when available—internal states, specified as a character vector.

Noise variance (covariance matrix) of the model innovations e. The estimation algorithm typically sets this property. However, you can also assign the covariance values by specifying an ny-by-ny matrix.

Sample time, specified as a positive scalar representing the sampling period. This value is expressed in the unit specified by the TimeUnit property of the model.

Units for the time variable, the sample time Ts, and any time delays in the model, specified as one of the following values:

  • 'nanoseconds'

  • 'microseconds'

  • 'milliseconds'

  • 'seconds'

  • 'minutes'

  • 'hours'

  • 'days'

  • 'weeks'

  • 'months'

  • 'years'

Changing this property has no effect on other properties, and therefore changes the overall system behavior. Use chgTimeUnit (Control System Toolbox) to convert between time units without modifying system behavior.

Input channel names, specified as one of the following:

  • Character vector — For single-input models, for example, 'controls'.

  • Cell array of character vectors — For multi-input models.

Input names in Nonlinear ARX models must be valid MATLAB® variable names after you remove any spaces.

Alternatively, use automatic vector expansion to assign input names for multi-input models. For example, if sys is a two-input model, enter:

sys.InputName = 'controls';

The input names automatically expand to {'controls(1)';'controls(2)'}.

When you estimate a model using an iddata object, data, the software automatically sets InputName to data.InputName.

You can use the shorthand notation u to refer to the InputName property. For example, sys.u is equivalent to sys.InputName.

Input channel names have several uses, including:

  • Identifying channels on model display and plots

  • Extracting subsystems of MIMO systems

  • Specifying connection points when interconnecting models

Input channel units, specified as one of the following:

  • Character vector — For single-input models, for example, 'seconds'.

  • Cell array of character vectors — For multi-input models.

Use InputUnit to keep track of input signal units. InputUnit has no effect on system behavior.

Input channel groups. The InputGroup property lets you assign the input channels of MIMO systems into groups and refer to each group by name. Specify input groups as a structure. In this structure, field names are the group names, and field values are the input channels belonging to each group. For example:

sys.InputGroup.controls = [1 2];
sys.InputGroup.noise = [3 5];

creates input groups named controls and noise that include input channels 1, 2 and 3, 5, respectively. You can then extract the subsystem from the controls inputs to all outputs using:

sys(:,'controls')

Output channel names, specified as one of the following:

  • Character vector — For single-output models. For example, 'measurements'.

  • Cell array of character vectors — For multi-output models.

Output names in Nonlinear ARX models must be valid MATLAB variable names after you remove any spaces.

Alternatively, use automatic vector expansion to assign output names for multi-output models. For example, if sys is a two-output model, enter:

sys.OutputName = 'measurements';

The output names automatically expand to {'measurements(1)';'measurements(2)'}.

When you estimate a model using an iddata object, data, the software automatically sets OutputName to data.OutputName.

You can use the shorthand notation y to refer to the OutputName property. For example, sys.y is equivalent to sys.OutputName.

Output channel names have several uses, including:

  • Identifying channels on model display and plots

  • Extracting subsystems of MIMO systems

  • Specifying connection points when interconnecting models

Output channel units, specified as one of the following:

  • Character vector — For single-output models. For example, 'seconds'.

  • Cell array of character vectors — For multi-output models.

Use OutputUnit to keep track of output signal units. OutputUnit has no effect on system behavior.

Output channel groups. The OutputGroup property lets you assign the output channels of MIMO systems into groups and refer to each group by name. Specify output groups as a structure. In this structure, field names are the group names, and field values are the output channels belonging to each group. For example:

sys.OutputGroup.temperature = [1];
sys.OutputGroup.measurement = [3 5];

creates output groups named temperature and measurement that include output channels 1, and 3, 5, respectively. You can then extract the subsystem from all inputs to the measurement outputs using:

sys('measurement',:)

System name, specified as a character vector. For example, 'system 1'.

Any text that you want to associate with the system, specified as a string or a cell array of character vectors. The property stores whichever data type you provide. For instance, if sys1 and sys2 are dynamic system models, you can set their Notes properties as follows.

sys1.Notes = "sys1 has a string.";
sys2.Notes = 'sys2 has a character vector.';
sys1.Notes
sys2.Notes
ans = 

    "sys1 has a string."


ans =

    'sys2 has a character vector.'

Any data you want to associate with the system, specified as any MATLAB data type.

Object Functions

For information about object functions for idnlarx, see Nonlinear ARX Models.

Examples

collapse all

Create an idnlarx model by specifying an ARX model order vector.

Create an order vector of the form [na nb nk], where na and nb are the orders of the A and B ARX model polynomials and nk is the number of input/output delays.

na = 2;
nb = 3;
nk = 5;
orders = [na nb nk];

Construct a nonlinear ARX model sys.

output_name = 'y1';
input_name = 'u1';

sys = idnlarx(output_name,input_name,[2 3 5]);

View the output function.

disp(sys.OutputFcn)
Wavelet Network

 Nonlinear Function: Wavelet network with number of units chosen automatically
 Linear Function: uninitialized
 Output Offset: uninitialized

               Inputs: {'y1(t-1)'  'y1(t-2)'  'u1(t-5)'  'u1(t-6)'  'u1(t-7)'}
              Outputs: {'y1(t)'}
         NonlinearFcn: '<Wavelet and scaling function units and their parameters>'
            LinearFcn: '<Linear function parameters>'
               Offset: '<Offset parameters>'
    EstimationOptions: '<Estimation options>'

By default, the model uses a wavelet network, represented by a idWaveletNetwork object, for the output function. The idWaveletNetwork object includes linear and nonlinear components.

View the Regressors property.

disp(sys.Regressors)
Linear regressors in variables y1, u1
       Variables: {'y1'  'u1'}
            Lags: {[1 2]  [5 6 7]}
     UseAbsolute: [0 0]
    TimeVariable: 't'

The idnlarx constructor transforms the model orders into the Regressors form.

  • The Lags array for y1, [1 2], is equivalent to the na value of 2. Both forms specify two consecutive output regressors, y1(t-1) and y1(t-2).

  • The Lags array for u1, [5 6 7], incorporates the three delays specified by the nb value of 3, and shifts them by the nk value of 5. The input regressors are therefore u1(t-5), u1(t-6), and u1(t-7).

View the regressors.

getreg(sys)
ans = 5x1 cell
    {'y1(t-1)'}
    {'y1(t-2)'}
    {'u1(t-5)'}
    {'u1(t-6)'}
    {'u1(t-7)'}

You can use the orders syntax to specify simple linear regressors. However, to create more complex regressors, use the regressor commands linearRegressor, polynomialRegressor, and customRegressor to create a combined regressor for the Regressors syntax.

Construct an idnlarx model by specifying linear regressors.

Create a linear regressor that contains two output lags and two input lags.

output_name = 'y1';
input_name = 'u1';
var_names = {output_name,input_name};

output_lag = [1 2];
input_lag = [1 2];
lags = {output_lag,input_lag};

reg = linearRegressor(var_names,lags)
reg = 
Linear regressors in variables y1, u1
       Variables: {'y1'  'u1'}
            Lags: {[1 2]  [1 2]}
     UseAbsolute: [0 0]
    TimeVariable: 't'

The model contains the regressors y(t-1), y(t-2), u(t-1), and u(t-2).

Construct the idnlarx model and view the regressors.

sys = idnlarx(output_name,input_name,reg);
getreg(sys)
ans = 4x1 cell
    {'y1(t-1)'}
    {'y1(t-2)'}
    {'u1(t-1)'}
    {'u1(t-2)'}

View the output function.

disp(sys.OutputFcn)
Wavelet Network

 Nonlinear Function: Wavelet network with number of units chosen automatically
 Linear Function: uninitialized
 Output Offset: uninitialized

               Inputs: {'y1(t-1)'  'y1(t-2)'  'u1(t-1)'  'u1(t-2)'}
              Outputs: {'y1(t)'}
         NonlinearFcn: '<Wavelet and scaling function units and their parameters>'
            LinearFcn: '<Linear function parameters>'
               Offset: '<Offset parameters>'
    EstimationOptions: '<Estimation options>'

View the regressor usage table.

disp(sys.RegressorUsage)
               y1:LinearFcn    y1:NonlinearFcn
               ____________    _______________

    y1(t-1)       true              true      
    y1(t-2)       true              true      
    u1(t-1)       true              true      
    u1(t-2)       true              true      

All the regressors are inputs to both the linear and nonlinear components of the idWaveletNetwork object.

Create a nonlinear ARX model with a linear regressor set.

Create a linear regressor that contains three output lags and two input lags.

output_name = 'y1';
input_name = 'u1';
var_names = {output_name,input_name};

output_lag = [1 2 3];
input_lag = [1 2];
lags = {output_lag,input_lag};

reg = linearRegressor(var_names,lags)
reg = 
Linear regressors in variables y1, u1
       Variables: {'y1'  'u1'}
            Lags: {[1 2 3]  [1 2]}
     UseAbsolute: [0 0]
    TimeVariable: 't'

Construct the nonlinear ARX model.

sys = idnlarx(output_name,input_name,reg);

View the Regressors property.

disp(sys.Regressors)
Linear regressors in variables y1, u1
       Variables: {'y1'  'u1'}
            Lags: {[1 2 3]  [1 2]}
     UseAbsolute: [0 0]
    TimeVariable: 't'

sys uses idWavenetNetwork as the default output function. Reconfigure the output function to idSigmoidNetwork.

sys.OutputFcn = 'idSigmoidNetwork';
disp(sys.OutputFcn)
Sigmoid Network

 Nonlinear Function: Sigmoid network with 10 units
 Linear Function: uninitialized
 Output Offset: uninitialized

          Inputs: {'y1(t-1)'  'y1(t-2)'  'y1(t-3)'  'u1(t-1)'  'u1(t-2)'}
         Outputs: {'y1(t)'}
    NonlinearFcn: '<Sigmoid units and their parameters>'
       LinearFcn: '<Linear function parameters>'
          Offset: '<Offset parameters>'

Specify the sigmoid network output function when you construct a nonlinear ARX model.

Assign variable names and specify a regressor set.

output_name = 'y1';
input_name = 'u1';
r = linearRegressor({output_name,input_name},{1 1});

Construct a nonlinear ARX model that specifies the idSigmoidNetwork output function. Set the number of terms in the sigmoid expansion to 15.

sys = idnlarx(output_name,input_name,r,idSigmoidNetwork(15));

View the output function specification.

disp(sys.OutputFcn)
Sigmoid Network

 Nonlinear Function: Sigmoid network with 15 units
 Linear Function: uninitialized
 Output Offset: uninitialized

          Inputs: {'y1(t-1)'  'u1(t-1)'}
         Outputs: {'y1(t)'}
    NonlinearFcn: '<Sigmoid units and their parameters>'
       LinearFcn: '<Linear function parameters>'
          Offset: '<Offset parameters>'

Construct an idnlarx model that uses only linear mapping in the output function. An argument value of [] is equivalent to an argument value of idLinear.

sys = idnlarx([2 2 1],[])
sys =

Nonlinear ARX model with 1 output and 1 input
  Inputs: u1
  Outputs: y1

Regressors:
  Linear regressors in variables y1, u1

Output function: Linear with offset
Sample time: 1 seconds

Status:                                                         
Created by direct construction or transformation. Not estimated.
More information in model's "Report" property.

Create a regressor set that includes linear, polynomial, periodic, and custom regressors.

Specify L as the set of linear regressors y1(t-1), u1(t-2), and u1(t-5).

L = linearRegressor({'y1','u1'},{1, [2 5]});

Specify P as the set of polynomial regressors y2(t-4)2, y2(t-5)2,y2(t-6)2, and y2(t-7)2.

P = polynomialRegressor('y2',4:7,2);

Specify SC as the set of periodic regressors sin(y1(t-1)), cos(y1(t-1)), sin(u1(t-2)), and cos(u1(t-2)).

SC = periodicRegressor({'y1','u1'},{1,2});

Specify C as the custom regressor sin(y1(t-1)u1(t-2)+u2(t-2)), using the @ symbol to create an anonymous function handle.

C = customRegressor({'y1','u1','u2'},{1 2 2},@(x,y,z)sin(x.*y+z));

Combine the regressors into one regressor set R.

R = [L;P;SC;C]
R = 
[4 1] array of linearRegressor, polynomialRegressor, periodicRegressor, customRegressor objects.
------------------------------------
1. Linear regressors in variables y1, u1
       Variables: {'y1'  'u1'}
            Lags: {[1]  [2 5]}
     UseAbsolute: [0 0]
    TimeVariable: 't'

------------------------------------
2. Order 2 regressors in variables y2
               Order: 2
           Variables: {'y2'}
                Lags: {[4 5 6 7]}
         UseAbsolute: 0
    AllowVariableMix: 0
         AllowLagMix: 0
        TimeVariable: 't'

------------------------------------
3. Periodic regressors in variables y1, u1 with 1 Fourier terms
       Variables: {'y1'  'u1'}
            Lags: {[1]  [2]}
               W: 1
        NumTerms: 1
          UseSin: 1
          UseCos: 1
    TimeVariable: 't'
     UseAbsolute: [0 0]

------------------------------------
4. Custom regressor: sin(y1(t-1).*u1(t-2)+u2(t-2))
    VariablesToRegressorFcn: @(x,y,z)sin(x.*y+z)
                  Variables: {'y1'  'u1'  'u2'}
                       Lags: {[1]  [2]  [2]}
                 Vectorized: 1
               TimeVariable: 't'


Create a nonlinear ARX model.

sys = idnlarx({'y1','y2'},{'u1','u2'},R)
sys =

Nonlinear ARX model with 2 outputs and 2 inputs
  Inputs: u1, u2
  Outputs: y1, y2

Regressors:
  1. Linear regressors in variables y1, u1
  2. Order 2 regressors in variables y2
  3. Periodic regressors in variables y1, u1 with W = 1, and 1 Fourier terms
  4. Custom regressor: sin(y1(t-1).*u1(t-2)+u2(t-2))

Output functions:
  Output 1:  Wavelet network with number of units chosen automatically
  Output 2:  Wavelet network with number of units chosen automatically

Sample time: 1 seconds

Status:                                                         
Created by direct construction or transformation. Not estimated.
More information in model's "Report" property.

Use a linear ARX model instead of a regressor set to construct a nonlinear ARX model.

Construct a linear ARX model using idpoly.

A = [1 -1.2 0.5];
B = [0.8 1];
LinearModel = idpoly(A, B, 'Ts', 0.1);

Specify input and output names for the model using dot notation.

LinearModel.OutputName = 'y1';
LinearModel.InputName = 'u1';

Construct a nonlinear ARX model using the linear ARX model.

m1 = idnlarx(LinearModel)
m1 =

Nonlinear ARX model with 1 output and 1 input
  Inputs: u1
  Outputs: y1

Regressors:
  Linear regressors in variables y1, u1

Output function: Wavelet network with number of units chosen automatically
Sample time: 0.1 seconds

Status:                                                         
Created by direct construction or transformation. Not estimated.
More information in model's "Report" property.

You can create a linear ARX model from any identified discrete-time linear model.

Estimate a second-order state-space model from estimation data z1.

load iddata1 z1
ssModel = ssest(z1,2,'Ts',0.1);

Construct a nonlinear ARX model from ssModel. The software uses the input and output names that ssModel extracts from z1.

m2 = idnlarx(ssModel)
m2 =

Nonlinear ARX model with 1 output and 1 input
  Inputs: u1
  Outputs: y1

Regressors:
  Linear regressors in variables y1, u1

Output function: Wavelet network with number of units chosen automatically
Sample time: 0.1 seconds

Status:                                                         
Created by direct construction or transformation. Not estimated.
More information in model's "Report" property.

Modify regressor assignments by modifying the RegressorUsage table.

Construct a nonlinear ARX model that has two inputs and two outputs.

Create the variable names and the regressors.

varnames = {'y1','y2','u1','u2'};
lags = {[1 2 3],[1 2],[1 2],[1 3]};
reg = linearRegressor(varnames,lags);

Create an output function specification fcn that uses idWaveletNetwork for mapping regressors to output y1 and idSigmoidNetwork for mapping regressors to output y2. Both mapping objects contain linear and nonlinear components.

fcn = [idWaveletNetwork;idSigmoidNetwork];

Construct the nonlinear ARX model.

output_name = {'y1' 'y2'};
input_name = {'u1' 'u2'};
sys = idnlarx(output_name,input_name,reg,fcn)
sys =

Nonlinear ARX model with 2 outputs and 2 inputs
  Inputs: u1, u2
  Outputs: y1, y2

Regressors:
  Linear regressors in variables y1, y2, u1, u2

Output functions:
  Output 1:  Wavelet network with number of units chosen automatically
  Output 2:  Sigmoid network with 10 units

Sample time: 1 seconds

Status:                                                         
Created by direct construction or transformation. Not estimated.
More information in model's "Report" property.

Display the RegressorUsage table.

disp(sys.RegressorUsage)
               y1:LinearFcn    y1:NonlinearFcn    y2:LinearFcn    y2:NonlinearFcn
               ____________    _______________    ____________    _______________

    y1(t-1)       true              true             true              true      
    y1(t-2)       true              true             true              true      
    y1(t-3)       true              true             true              true      
    y2(t-1)       true              true             true              true      
    y2(t-2)       true              true             true              true      
    u1(t-1)       true              true             true              true      
    u1(t-2)       true              true             true              true      
    u2(t-1)       true              true             true              true      
    u2(t-3)       true              true             true              true      

The rows of the table represent the regressors. The first two columns of the table represent the linear and nonlinear components of the mapping to output y1 (idWaveletNetwork). The last two columns represent the two components of the mapping to output y2 (idSigmoidNetwork).

In this table, all the input and output regressors are inputs to all components.

Remove the y2(t-2) regressor from the y2 nonlinear component.

sys.RegressorUsage{4,4} = false;
disp(sys.RegressorUsage)
               y1:LinearFcn    y1:NonlinearFcn    y2:LinearFcn    y2:NonlinearFcn
               ____________    _______________    ____________    _______________

    y1(t-1)       true              true             true              true      
    y1(t-2)       true              true             true              true      
    y1(t-3)       true              true             true              true      
    y2(t-1)       true              true             true              false     
    y2(t-2)       true              true             true              true      
    u1(t-1)       true              true             true              true      
    u1(t-2)       true              true             true              true      
    u2(t-1)       true              true             true              true      
    u2(t-3)       true              true             true              true      

The table displays false for this regressor-component pair.

Store the regressor names in Names.

Names = sys.RegressorUsage.Properties.RowNames;

Determine the indices of the rows that contain y1 or y2 and set the corresponding values of y1:NonlinearFcn to False.

idx = contains(Names,'y1')|contains(Names,'y2');
sys.RegressorUsage{idx,2} = false;
disp(sys.RegressorUsage)
               y1:LinearFcn    y1:NonlinearFcn    y2:LinearFcn    y2:NonlinearFcn
               ____________    _______________    ____________    _______________

    y1(t-1)       true              false            true              true      
    y1(t-2)       true              false            true              true      
    y1(t-3)       true              false            true              true      
    y2(t-1)       true              false            true              false     
    y2(t-2)       true              false            true              true      
    u1(t-1)       true              true             true              true      
    u1(t-2)       true              true             true              true      
    u2(t-1)       true              true             true              true      
    u2(t-3)       true              true             true              true      

The table values reflect the new assignments.

The RegressorUsage table provides complete flexibility for individually controlling regressor assignments.

More About

expand all

Version History

Introduced in R2007a

expand all