partialDependence
Compute partial dependence
Syntax
Description
computes the partial dependence pd = partialDependence(RegressionMdl,Vars)pd between the predictor variables
listed in Vars and model predictions. In this syntax, the model
predictions are the responses predicted by using the regression model
RegressionMdl, which contains predictor data.
computes the partial dependence pd = partialDependence(ClassificationMdl,Vars,Labels)pd between the predictor variables
listed in Vars and the scores for the classes specified in
Labels by using the classification model
ClassificationMdl, which contains predictor data.
uses additional options specified by one or more name-value arguments. For example, if you
specify pd = partialDependence(___,Name,Value)"UseParallel","true", the
partialDependence function uses parallel computing to perform the
partial dependence calculations.
Examples
Train a naive Bayes classification model with the fisheriris data set, and compute partial dependence values that show the relationship between the predictor variable and the predicted scores (posterior probabilities) for multiple classes.
Load the fisheriris data set, which contains species (species) and measurements (meas) on sepal length, sepal width, petal length, and petal width for 150 iris specimens. The data set contains 50 specimens from each of three species: setosa, versicolor, and virginica.
load fisheririsTrain a naive Bayes classification model with species as the response and meas as predictors.
Mdl = fitcnb(meas,species,"PredictorNames", ... ["Sepal Length","Sepal Width","Petal Length","Petal Width"]);
Compute partial dependence values on the third predictor variable (petal length) of the scores predicted by Mdl for all three classes of species. Specify the class labels by using the ClassNames property of Mdl.
[pd,x] = partialDependence(Mdl,3,Mdl.ClassNames);
pd contains the partial dependence values for the query points x. You can plot the computed partial dependence values by using plotting functions such as plot and bar. Plot pd against x by using the bar function.
bar(x,pd) legend(Mdl.ClassNames) xlabel("Petal Length") ylabel("Scores") title("Partial Dependence Plot")

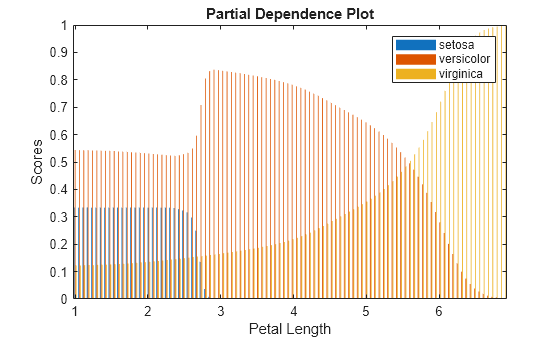
According to this model, the probability of virginica increases with petal length. The probability of setosa is about 0.33, from where petal length is 0 to around 2.5, and then the probability drops to almost 0.
Alternatively, you can use the plotPartialDependence function to compute and plot partial dependence values.
plotPartialDependence(Mdl,3,Mdl.ClassNames)

Train an ensemble of classification models and compute partial dependence values on two variables for multiple classes. Then plot the partial dependence values for each class.
Load the census1994 data set, which contains US yearly salary data, categorized as <=50K or >50K, and several demographic variables.
load census1994Extract a subset of variables to analyze from the table adultdata.
X = adultdata(1:500,["age","workClass","education_num","marital_status","race", ... "sex","capital_gain","capital_loss","hours_per_week","salary"]);
Train a random forest of classification trees by using fitcensemble and specifying Method as "Bag". For reproducibility, use a template of trees created by using templateTree with the Reproducible option.
rng("default") t = templateTree("Reproducible",true); Mdl = fitcensemble(X,"salary","Method","Bag","Learners",t);
Inspect the class names in Mdl.
Mdl.ClassNames
ans = 2×1 categorical
<=50K
>50K
Compute partial dependence values of the scores on the predictors age and education_num for both classes (<=50K and >50K). Specify the number of observations to sample as 100.
[pd,x,y] = partialDependence(Mdl,["age","education_num"],Mdl.ClassNames,"NumObservationsToSample",100);
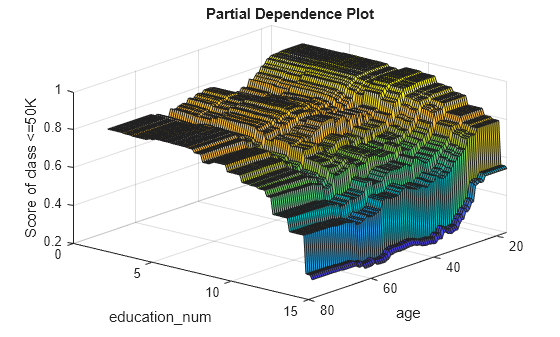
Create a surface plot of the partial dependence values for the first class (<=50K) by using the surf function.
figure surf(x,y,squeeze(pd(1,:,:))) xlabel("age") ylabel("education\_num") zlabel("Score of class <=50K") title("Partial Dependence Plot") view([130 30]) % Modify the viewing angle

Create a surface plot of the partial dependence values for the second class (>50K).
figure surf(x,y,squeeze(pd(2,:,:))) xlabel("age") ylabel("education\_num") zlabel("Score of class >50K") title("Partial Dependence Plot") view([130 30]) % Modify the viewing angle

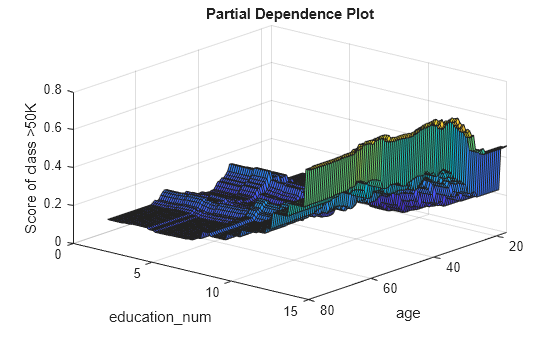
The two plots show different partial dependence patterns depending on the class.
Load the carbig sample data set.
load carbigThe vectors Displacement, Cylinders, and Model_Year contain data for car engine displacement, number of engine cylinders, and year the car was manufactured, respectively.
Fit a multinomial regression model using Displacement and Cylinders as predictor variables and Model_Year as the response.
predvars = [Displacement,Cylinders]; Mdl = fitmnr(predvars,Model_Year,PredictorNames=["Displacement","Cylinders"]);
Create a vector of noisy predictor data from the predictor variables by using the rand function.
Data = predvars(1:10:end,:);
rng("default")
rows = length(Data);
Data = Data + 10*rand([rows,2]);Calculate the partial dependence of the response category probability corresponding to cars manufactured in 1980 on Displacement. Use the noisy predictor data to calculate the partial dependence.
[pd,x,~] = partialDependence(Mdl,"Displacement",80,Data)pd = 1×100
0.0030 0.0031 0.0031 0.0032 0.0032 0.0033 0.0033 0.0033 0.0034 0.0034 0.0035 0.0035 0.0036 0.0036 0.0036 0.0037 0.0037 0.0037 0.0038 0.0038 0.0038 0.0039 0.0039 0.0039 0.0039 0.0039 0.0040 0.0040 0.0040 0.0040 0.0040 0.0040 0.0040 0.0040 0.0040 0.0040 0.0040 0.0040 0.0040 0.0040 0.0039 0.0039 0.0039 0.0039 0.0038 0.0038 0.0038 0.0037 0.0037 0.0036
x = 100×1
73.7850
77.1781
80.5713
83.9644
87.3575
90.7507
94.1438
97.5370
100.9301
104.3232
107.7164
111.1095
114.5027
117.8958
121.2890
⋮
The output shows the calculated values for the partial dependence of the category probability on Displacement. Because Displacement is a continuous variable, the partialDependence function calculates the partial dependence at 100 equally spaced query points x.
Plot the partial dependence using plotPartialDependence.
plotPartialDependence(Mdl,"Displacement",80,Data)
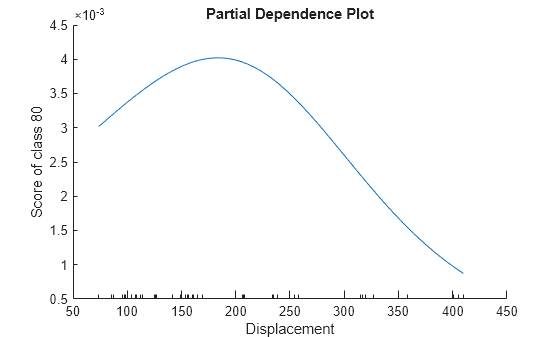
The plot shows that when Displacement increases from approximately 70 to approximately 180, the probability of a car being manufactured in 1980 increases. As Displacement continues to increase, the probability of a car being manufactured in 1980 decreases.
Train a support vector machine (SVM) regression model using the carsmall data set, and compute the partial dependence on two predictor variables. Then, create a figure that shows the partial dependence on the two variables along with the histogram on each variable.
Load the carsmall data set.
load carsmallCreate a table that contains Weight, Cylinders, Displacement, and Horsepower.
Tbl = table(Weight,Cylinders,Displacement,Horsepower);
Train an SVM regression model using the predictor variables in Tbl and the response variable MPG. Use a Gaussian kernel function with an automatic kernel scale.
Mdl = fitrsvm(Tbl,MPG,"ResponseName","MPG", ... "CategoricalPredictors","Cylinders","Standardize",true, ... "KernelFunction","gaussian","KernelScale","auto");
Compute the partial dependence of the predicted response (MPG) on the predictor variables Weight and Horsepower. Specify query points to compute the partial dependence by using the QueryPoints name-value argument.
numPoints = 10; ptX = linspace(min(Weight),max(Weight),numPoints)'; ptY = linspace(min(Horsepower),max(Horsepower),numPoints)'; [pd,x,y] = partialDependence(Mdl,["Weight","Horsepower"],"QueryPoints",[ptX ptY]);
Create a figure that contains a 5-by-5 tiled chart layout. Plot the partial dependence on the two variables by using the imagesc function. Then draw the histogram for each variable by using the histogram function. Specify the edges of the histograms so that the centers of the histogram bars align with the query points. Change the axes properties to align the axes of the plots.
t = tiledlayout(5,5,"TileSpacing","compact"); ax1 = nexttile(2,[4,4]); imagesc(x,y,pd) title("Partial Dependence Plot") colorbar("eastoutside") ax1.YDir = "normal"; ax2 = nexttile(22,[1,4]); dX = diff(ptX(1:2)); edgeX = [ptX-dX/2;ptX(end)+dX]; histogram(Weight,edgeX); xlabel("Weight") xlim(ax1.XLim); ax3 = nexttile(1,[4,1]); dY = diff(ptY(1:2)); edgeY = [ptY-dY/2;ptY(end)+dY]; histogram(Horsepower,edgeY) xlabel("Horsepower") xlim(ax1.YLim); ax3.XDir = "reverse"; camroll(-90)

Each element of pd specifies the color for one pixel of the image plot. The histograms aligned with the axes of the image show the distribution of the predictors.
Compute the partial dependence of label scores on predictor variables for a SemiSupervisedSelfTrainingModel object. You cannot pass a SemiSupervisedSelfTrainingModel object directly to the partialDependence function. Instead, define a custom function that returns label scores for the object, and then pass the function to partialDependence.
Randomly generate 15 observations of labeled data, with five observations in each of three classes.
rng("default") % For reproducibility labeledX = [randn(5,2)*0.25 + ones(5,2); randn(5,2)*0.25 - ones(5,2); randn(5,2)*0.5]; Y = [ones(5,1); ones(5,1)*2; ones(5,1)*3];
Randomly generate 300 additional observations of unlabeled data, with 100 observations per class.
unlabeledX = [randn(100,2)*0.25 + ones(100,2);
randn(100,2)*0.25 - ones(100,2);
randn(100,2)*0.5];Fit labels to the unlabeled data by using a semi-supervised self-training method. The function fitsemiself returns a SemiSupervisedSelfTrainingModel object.
Mdl = fitsemiself(labeledX,Y,unlabeledX);
Define the custom function myLabelScores, which returns label scores computed by the predict function of SemiSupervisedSelfTrainingModel; the custom function definition appears at the end of this example.
Compute the partial dependence of the scores for unlabeledX on each variable for all classes. partialDependence accepts a custom model in the form of a function handle. The function represented by the function handle must accept predictor data and return a column vector or matrix with one row for each observation. Specify the custom model as @(X)myLabelScores(Mdl,X) so that the custom function uses the trained model Mdl and accepts predictor data.
[pd1,x1] = partialDependence(@(X)myLabelScores(Mdl,X),1,unlabeledX); [pd2,x2] = partialDependence(@(X)myLabelScores(Mdl,X),2,unlabeledX);
You can plot the computed partial dependence values by using plotting functions such as plot and bar. Alternatively, you can use the plotPartialDependence function to compute and plot partial dependence values.
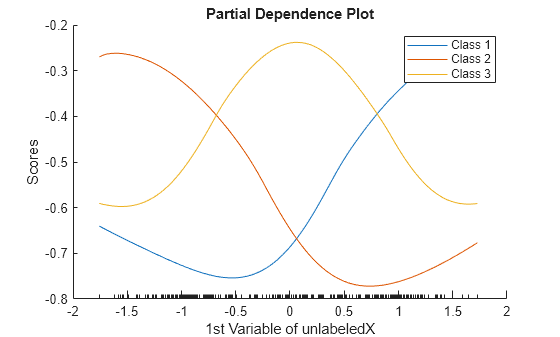
Create partial dependence plots for the first variable and all classes.
plotPartialDependence(@(X)myLabelScores(Mdl,X),1,unlabeledX) xlabel("1st Variable of unlabeledX") ylabel("Scores") legend("Class 1","Class 2","Class 3")

Custom Function myLabelScores
function scores = myLabelScores(Mdl,X) [~,scores] = predict(Mdl,X); end
Input Arguments
Regression model, specified as a full or compact regression model object, as given in the following tables of supported models.
| Model | Full or Compact Model Object |
|---|---|
| Generalized linear model | GeneralizedLinearModel, CompactGeneralizedLinearModel |
| Generalized linear mixed-effect model | GeneralizedLinearMixedModel |
| Linear regression | LinearModel, CompactLinearModel |
| Linear mixed-effect model | LinearMixedModel |
| Nonlinear regression | NonLinearModel |
| Censored linear regression | CensoredLinearModel, CompactCensoredLinearModel |
| Ensemble of regression models | RegressionEnsemble, RegressionBaggedEnsemble,
CompactRegressionEnsemble |
| Generalized additive model (GAM) | RegressionGAM, CompactRegressionGAM |
| Gaussian process regression | RegressionGP, CompactRegressionGP |
| Gaussian kernel regression model using random feature expansion | RegressionKernel |
| Linear regression for high-dimensional data | RegressionLinear |
| Neural network regression model | RegressionNeuralNetwork, CompactRegressionNeuralNetwork |
| Support vector machine (SVM) regression | RegressionSVM, CompactRegressionSVM |
| Regression tree | RegressionTree, CompactRegressionTree |
| Bootstrap aggregation for ensemble of decision trees | TreeBagger, CompactTreeBagger |
If
RegressionMdlis a model object that does not contain predictor data (for example, a compact model), you must provide the input argumentData.partialDependencedoes not support a model object trained with a sparse matrix. When you train a model, use a full numeric matrix or table for predictor data where rows correspond to individual observations.partialDependencedoes not support a model object trained with more than one response variable.
Classification model, specified as a full or compact classification model object, as given in the following table of supported models.
| Model | Full or Compact Model Object |
|---|---|
| Discriminant analysis classifier | ClassificationDiscriminant, CompactClassificationDiscriminant |
| Multiclass model for support vector machines or other classifiers | ClassificationECOC, CompactClassificationECOC |
| Ensemble of learners for classification | ClassificationEnsemble, CompactClassificationEnsemble, ClassificationBaggedEnsemble |
| Generalized additive model (GAM) | ClassificationGAM, CompactClassificationGAM |
| Gaussian kernel classification model using random feature expansion | ClassificationKernel |
| k-nearest neighbor classifier | ClassificationKNN |
| Linear classification model | ClassificationLinear |
| Multiclass naive Bayes model | ClassificationNaiveBayes, CompactClassificationNaiveBayes |
| Neural network classifier | ClassificationNeuralNetwork, CompactClassificationNeuralNetwork |
| Support vector machine (SVM) classifier for one-class and binary classification | ClassificationSVM, CompactClassificationSVM |
| Binary decision tree for multiclass classification | ClassificationTree, CompactClassificationTree |
| Bagged ensemble of decision trees | TreeBagger, CompactTreeBagger |
| Multinomial regression model | MultinomialRegression |
If ClassificationMdl is a model object that does not contain predictor
data (for example, a compact model), you must provide the input argument
Data.
partialDependence does not support a model object trained with a sparse matrix. When you train a model, use a full numeric matrix or table for predictor data where rows correspond to individual observations.
Custom model, specified as a function handle. The function handle fun
must represent a function that accepts the predictor data Data and
returns an output in the form of a column vector or matrix. Each row of the output must
correspond to each observation (row) in the predictor data.
By default, partialDependence uses all output columns of
fun for the partial dependence computation. You can specify
which output columns to use by setting the OutputColumns name-value
argument.
If the predictor data (Data) is in a table,
partialDependence assumes that a variable is categorical if it is a
logical vector, categorical vector, character array, string array, or cell array of
character vectors. If the predictor data is a matrix, partialDependence
assumes that all predictors are continuous. To identify any other predictors as
categorical predictors, specify them by using the
CategoricalPredictors name-value argument.
Data Types: function_handle
Predictor variables, specified as a vector of positive integers, character vector, string scalar, string array, or cell array of character vectors. You can specify one or two predictor variables, as shown in the following tables.
One Predictor Variable
| Value | Description |
|---|---|
| positive integer | Index value corresponding to the column of the predictor data. |
| character vector or string scalar | Name of the predictor variable. The name must match the entry in the
|
Two Predictor Variables
| Value | Description |
|---|---|
| vector of two positive integers | Index values corresponding to the columns of the predictor data. |
| string array or cell array of character vectors | Names of the predictor variables. Each element in the array is the name of a predictor
variable. The names must match the entries in the
|
Example: ["x1","x3"]
Data Types: single | double | char | string | cell
Class labels, specified as a categorical or character array, logical or numeric
vector, or cell array of character vectors. The values and data types in
Labels must match those of the class names in the
ClassNames property of ClassificationMdl
(ClassificationMdl.ClassNames).
You can specify one or multiple class labels.
This argument is valid only when you specify a classification model object
ClassificationMdl.
Example: ["red","blue"]
Example: ClassificationMdl.ClassNames([1 3]) specifies
Labels as the first and third classes in
ClassificationMdl.
Data Types: single | double | logical | char | cell | categorical
Predictor data, specified as a numeric matrix or table. Each row of
Data corresponds to one observation, and each column
corresponds to one variable.
For both a regression model (RegressionMdl) and a classification
model (ClassificationMdl), Data must be
consistent with the predictor data that trained the model, stored in either the
X or Variables property.
If you trained the model using a numeric matrix, then
Datamust be a numeric matrix. The variables that make up the columns ofDatamust have the same number and order as the predictor variables that trained the model.If you trained the model using a table (for example,
Tbl), thenDatamust be a table. All predictor variables inDatamust have the same variable names and data types as the names and types inTbl. However, the column order ofDatadoes not need to correspond to the column order ofTbl.Datamust not be sparse.
If you specify a regression or classification model that does not contain predictor
data, you must provide Data. If the model is a full model object
that contains predictor data and you specify the Data argument,
then partialDependence ignores the predictor data in the model and uses
Data only.
If you specify a custom model fun, you must provide
Data.
Data Types: single | double | table
Name-Value Arguments
Specify optional pairs of arguments as
Name1=Value1,...,NameN=ValueN, where Name is
the argument name and Value is the corresponding value.
Name-value arguments must appear after other arguments, but the order of the
pairs does not matter.
Before R2021a, use commas to separate each name and value, and enclose
Name in quotes.
Example: partialDependence(Mdl,Vars,Data,"NumObservationsToSample",100,"UseParallel",true)
computes the partial dependence values by using 100 sampled observations in
and executing Datafor-loop
iterations in parallel.
Flag to include interaction terms of the generalized additive model (GAM) in the partial
dependence computation, specified as true or
false. This argument is valid only for a GAM. That is, you can
specify this argument only when RegressionMdl is RegressionGAM
or CompactRegressionGAM, or ClassificationMdl is ClassificationGAM or CompactClassificationGAM.
The default IncludeInteractions value is true if the
model contains interaction terms. The value must be false if the
model does not contain interaction terms.
Example: "IncludeInteractions",false
Data Types: logical
Flag to include an intercept term of the generalized additive model (GAM) in the partial
dependence computation, specified as true or
false. This argument is valid only for a GAM. That is, you can
specify this argument only when RegressionMdl is RegressionGAM
or CompactRegressionGAM, or ClassificationMdl is ClassificationGAM or CompactClassificationGAM.
Example: "IncludeIntercept",false
Data Types: logical
Number of observations to sample, specified as a positive integer. The default value is the
number of total observations in Data or the model
(RegressionMdl or ClassificationMdl). If you
specify a value larger than the number of total observations, then
partialDependence uses all observations.
partialDependence samples observations without replacement by using the
datasample function and uses the sampled observations to compute partial
dependence.
Example: "NumObservationsToSample",100
Data Types: single | double
Points to compute partial dependence for numeric predictors, specified as a numeric column vector, a numeric two-column matrix, or a cell array of two numeric column vectors.
If you select one predictor variable in
Vars, use a numeric column vector.If you select two predictor variables in
Vars:Use a numeric two-column matrix to specify the same number of points for each predictor variable.
Use a cell array of two numeric column vectors to specify a different number of points for each predictor variable.
The default value is a numeric column vector or a numeric two-column matrix, depending on the number of selected predictor variables. Each column contains 100 evenly spaced points between the minimum and maximum values of the sampled observations for the corresponding predictor variable.
You cannot modify QueryPoints for a categorical variable. The
partialDependence function uses all categorical values in the
selected variable.
If you select one numeric variable and one categorical variable, you can specify
QueryPoints for a numeric variable by using a cell array
consisting of a numeric column vector and an empty array.
Example: "QueryPoints",{pt,[]}
Data Types: single | double | cell
Flag to run in parallel, specified as true or
false. If you specify "UseParallel",true, the
partialDependence function executes for-loop
iterations by using parfor when predicting responses or
scores for each observation and averaging them. The loop runs in parallel when you have
Parallel Computing Toolbox™.
Example: "UseParallel",true
Data Types: logical
Categorical predictors list for the custom model fun, specified as one of the values in this table.
| Value | Description |
|---|---|
| Vector of positive integers | Each entry in the vector is an index value indicating that the corresponding predictor is categorical. The index values are between 1 and |
| Logical vector | A |
| Character matrix | Each row of the matrix is the name of a predictor variable. The names must match the variable names of the predictor data Data in a table. Pad the names with extra blanks so each row of the character matrix has the same length. |
| String array or cell array of character vectors | Each element in the array is the name of a predictor variable. The names must match the variable names of the predictor data Data in a table. |
"all" | All predictors are categorical. |
By default, if the predictor data Data is in a table, partialDependence assumes that a variable is categorical if it is a logical vector, categorical vector, character array, string array, or cell array of character vectors. If the predictor data is a matrix, partialDependence assumes that all predictors are continuous. To identify any other predictors as categorical predictors, specify them by using the CategoricalPredictors name-value argument.
This argument is valid only when you specify a custom model by using fun.
Example: "CategoricalPredictors","all"
Data Types: single | double | logical | char | string | cell
Output columns of the custom model fun to use for the partial dependence computation, specified as one of the values in this table.
| Value | Description |
|---|---|
| Vector of positive integers | Each entry in the vector is an index value indicating that |
| Logical vector | A |
"all" | partialDependence uses all output columns for the partial dependence computation. |
This argument is valid only when you specify a custom model by using
fun.
Example: "OutputColumns",[1 2]
Data Types: single | double | logical | char | string
Since R2024a
Predicted response value to use for observations with missing predictor values,
specified as "median", "mean", or a numeric
scalar.
| Value | Description |
|---|---|
"median" | partialDependence uses the median of the observed response
values in the training data as the predicted response value for observations
with missing predictor values. |
"mean" | partialDependence uses the mean of the observed response
values in the training data as the predicted response value for observations
with missing predictor values. |
| Numeric scalar |
If you specify |
If an observation has a missing value in a Vars predictor
variable, then partialDependence does not use the observation in
partial dependence computations.
Note
This name-value argument is valid only for these types of regression models:
Gaussian process regression, kernel, linear, neural network, and support vector
machine. That is, you can specify this argument only when
RegressionMdl is a RegressionGP,
CompactRegressionGP, RegressionKernel,
RegressionLinear, RegressionNeuralNetwork,
CompactRegressionNeuralNetwork, RegressionSVM,
or CompactRegressionSVM object.
Example: "PredictionForMissingValue","mean"
Example: "PredictionForMissingValue",NaN
Data Types: single | double | char | string
Output Arguments
Partial dependence values, returned as a numeric array.
The dimension of pd depends on the type of model (regression,
classification or custom), number of variables specified in Vars,
number of classes specified in Labels (classification model only),
and number of columns specified in OutputColumns (custom model
only).
For a regression model (RegressionMdl), the following
conditions apply:
If you specify two variables in
Vars,pdis anumY-by-numXmatrix, wherenumYandnumXare the number of query points of the second and first variables inVars, respectively. The value inpd(i,j)is the partial dependence value of the query point corresponding toandy(i).x(j)is they(i)ith query point of the second predictor variable, andis thex(j)jth query point of the first predictor variable.If you specify one variable in
Vars,pdis a1-by-numXvector.
For a classification model (ClassificationMdl), the following
conditions apply:
If you specify two variables in
Vars,pdis anum-by-numY-by-numXarray, wherenumis the number of class labels inLabels. The value inpd(i,j,k)is the partial dependence value of the query pointandy(j)for thex(k)ith class label inLabels.If you specify one variable in
Vars,pdis anum-by-numXmatrix.If you specify one class in
Labels,pdis anumY-by-numXmatrix.If you specify one variable and one class,
pdis a1-by-numXvector.
For a custom model (fun), the following conditions apply:
If you specify two variables in
Vars,pdis anum-by-numY-by-numXarray, wherenumis the number of output columns inOutputColumns. The value inpd(i,j,k)is the partial dependence value of the query pointandy(j)for thex(k)ith column inOutputColumns.If you specify one variable in
Vars,pdis anum-by-numXmatrix.If you specify one column in
OutputColumns,pdis anumY-by-numXmatrix.If you specify one variable and one column,
pdis a1-by-numXvector.
Query points of the first predictor variable in Vars, returned
as a numeric or categorical column vector.
If the predictor variable is numeric, then you can specify the query points by using
the QueryPoints name-value argument.
Data Types: single | double | categorical
Query points of the second predictor variable in Vars, returned
as a numeric or categorical column vector. This output argument is empty
([]) if you specify only one variable in
Vars.
If the predictor variable is numeric, then you can specify the query points by using
the QueryPoints name-value argument.
Data Types: single | double | categorical
More About
Partial dependence [1] represents the relationships between
predictor variables and predicted responses in a trained regression model.
partialDependence computes the partial dependence of predicted responses
on a subset of predictor variables by marginalizing over the other variables.
Consider partial dependence on a subset XS of the whole predictor variable set X = {x1, x2, …, xm}. A subset XS includes either one variable or two variables: XS = {xS1} or XS = {xS1, xS2}. Let XC be the complementary set of XS in X. A predicted response f(X) depends on all variables in X:
f(X) = f(XS, XC).
The partial dependence of predicted responses on XS is defined by the expectation of predicted responses with respect to XC:
where
pC(XC)
is the marginal probability of XC, that is, . Assuming that each observation is equally likely, and the dependence
between XS and
XC and the interactions of
XS and
XC in responses is not strong,
partialDependence estimates the partial dependence by using observed
predictor data as follows:
| (1) |
where N is the number of observations and Xi = (XiS, XiC) is the ith observation.
When you call the partialDependence function, you can specify a trained
model (f(·)) and select variables
(XS) by using the input arguments
RegressionMdl and Vars, respectively.
partialDependence computes the partial dependence at 100 evenly spaced
points of XS or the points that you specify by
using the QueryPoints name-value argument. You can specify the number
(N) of observations to sample from given predictor data by using the
NumObservationsToSample name-value argument.
In the case of classification models,
partialDependence computes the partial dependence in the same way as
for regression models, with one exception: instead of using the predicted responses from the
model, the function uses the predicted scores for the classes specified in
Labels.
The weighted traversal algorithm [1] is a method to estimate partial dependence for a tree-based model. The estimated partial dependence is the weighted average of response or score values corresponding to the leaf nodes visited during the tree traversal.
Let XS be a subset of the whole variable set X and XC be the complementary set of XS in X. For each XS value to compute partial dependence, the algorithm traverses a tree from the root (beginning) node down to leaf (terminal) nodes and finds the weights of leaf nodes. The traversal starts by assigning a weight value of one at the root node. If a node splits by XS, the algorithm traverses to the appropriate child node depending on the XS value. The weight of the child node becomes the same value as its parent node. If a node splits by XC, the algorithm traverses to both child nodes. The weight of each child node becomes a value of its parent node multiplied by the fraction of observations corresponding to each child node. After completing the tree traversal, the algorithm computes the weighted average by using the assigned weights.
For an ensemble of bagged trees, the estimated partial dependence is an average of the weighted averages over the individual trees.
Algorithms
For both a regression model (RegressionMdl) and a classification
model (ClassificationMdl), partialDependence uses a
predict function to predict responses or scores.
partialDependence chooses the proper predict
function according to the model and runs predict with its default settings.
For details about each predict function, see the predict
functions in the following two tables. If the specified model is a tree-based model (not
including a boosted ensemble of trees), then partialDependence uses the
weighted traversal algorithm instead of the predict function. For details,
see Weighted Traversal Algorithm.
Regression Model Object
| Model Type | Full or Compact Regression Model Object | Function to Predict Responses |
|---|---|---|
| Bootstrap aggregation for ensemble of decision trees | CompactTreeBagger | predict |
| Bootstrap aggregation for ensemble of decision trees | TreeBagger | predict |
| Ensemble of regression models | RegressionEnsemble, RegressionBaggedEnsemble, CompactRegressionEnsemble | predict |
| Gaussian kernel regression model using random feature expansion | RegressionKernel | predict |
| Gaussian process regression | RegressionGP, CompactRegressionGP | predict |
| Generalized additive model | RegressionGAM, CompactRegressionGAM | predict |
| Generalized linear mixed-effect model | GeneralizedLinearMixedModel | predict |
| Generalized linear model | GeneralizedLinearModel, CompactGeneralizedLinearModel | predict |
| Linear mixed-effect model | LinearMixedModel | predict |
| Linear regression | LinearModel, CompactLinearModel | predict |
| Linear regression for high-dimensional data | RegressionLinear | predict |
| Neural network regression model | RegressionNeuralNetwork, CompactRegressionNeuralNetwork | predict |
| Nonlinear regression | NonLinearModel | predict |
| Censored linear regression | CensoredLinearModel, CompactCensoredLinearModel | predict |
| Regression tree | RegressionTree, CompactRegressionTree | predict |
| Support vector machine | RegressionSVM, CompactRegressionSVM | predict |
Classification Model Object
Alternative Functionality
plotPartialDependencecomputes and plots partial dependence values. The function can also create individual conditional expectation (ICE) plots.
References
[1] Friedman, Jerome. H. “Greedy Function Approximation: A Gradient Boosting Machine.” The Annals of Statistics 29, no. 5 (2001): 1189-1232.
[2] Hastie, Trevor, Robert Tibshirani, and Jerome Friedman. The Elements of Statistical Learning. New York, NY: Springer New York, 2009.
Extended Capabilities
To run in parallel, set the UseParallel name-value argument to
true in the call to this function.
For more general information about parallel computing, see Run MATLAB Functions with Automatic Parallel Support (Parallel Computing Toolbox).
Usage notes and limitations:
This function fully supports GPU arrays for the following regression and classification models:
LinearModelandCompactLinearModelobjectsGeneralizedLinearModelandCompactGeneralizedLinearModelobjectsRegressionKernelandClassificationKernelobjectsRegressionSVMandCompactRegressionSVMobjectsRegressionNeuralNetworkandCompactRegressionNeuralNetworkobjectsClassificationNeuralNetworkandCompactClassificationNeuralNetworkRegressionLinearobjectsClassificationLinearobjects
This function supports GPU arrays with limitations for the regression and classification models described in this table.
Full or Compact Model Object Limitations ClassificationECOCorCompactClassificationECOCBinary learners are subject to limitations depending on type:
Ensemble learners have the same limitations as
ClassificationEnsemble.KNN learners have the same limitations as
ClassificationKNNSVM learners have the same limitations as
ClassificationSVMTree learners have the same limitations as
ClassificationTree
ClassificationEnsemble,CompactClassificationEnsemble,RegressionEnsemble, orCompactRegressionEnsembleWeak learners are subject to limitations depending on type:
KNN learners have the same limitations as
ClassificationKNN.Tree learners have the same limitations as
ClassificationTree.Discriminant learners are not supported.
ClassificationKNNModels trained using the Kd-tree nearest neighbor search method, function handle or
fastdistance metrics, or tie inclusion are not supported.ClassificationSVMorCompactClassificationSVMOne-class classification is not supported
ClassificationTree,CompactClassificationTree,RegressionTree, orCompactRegressionTreeSurrogate splits are not supported for decision trees.
This function fully supports GPU arrays for a custom function if the custom function supports GPU arrays.
For more information, see Run MATLAB Functions on a GPU (Parallel Computing Toolbox).
Version History
Introduced in R2020bpartialDependence allows you to specify censored linear regression models
using a CensoredLinearModel or CompactCensoredLinearModel
object.
partialDependence fully supports GPU arrays for RegressionKernel and ClassificationKernel models.
partialDependence fully supports GPU arrays for RegressionNeuralNetwork, CompactRegressionNeuralNetwork, ClassificationNeuralNetwork, and CompactClassificationNeuralNetwork models.
If RegressionMdl is a Gaussian process regression, kernel, linear,
neural network, or support vector machine model, you can now use observations with missing
predictor values in partial dependence computations. Specify the
PredictionForMissingValue name-value argument.
A value of
"median"is consistent with the behavior in R2023b.A value of
NaNis consistent with the behavior in R2023a, where the regression models do not support using observations with missing predictor values for prediction.
partialDependence fully supports GPU arrays for
RegressionLinear models.
Starting in R2024a, partialDependence fully supports GPU arrays for
ClassificationLinear models.
Starting in R2023a, partialDependence fully supports GPU arrays for
RegressionSVM and
CompactRegressionSVM models.
MATLAB Command
You clicked a link that corresponds to this MATLAB command:
Run the command by entering it in the MATLAB Command Window. Web browsers do not support MATLAB commands.
Select a Web Site
Choose a web site to get translated content where available and see local events and offers. Based on your location, we recommend that you select: .
You can also select a web site from the following list
How to Get Best Site Performance
Select the China site (in Chinese or English) for best site performance. Other MathWorks country sites are not optimized for visits from your location.
Americas
- América Latina (Español)
- Canada (English)
- United States (English)
Europe
- Belgium (English)
- Denmark (English)
- Deutschland (Deutsch)
- España (Español)
- Finland (English)
- France (Français)
- Ireland (English)
- Italia (Italiano)
- Luxembourg (English)
- Netherlands (English)
- Norway (English)
- Österreich (Deutsch)
- Portugal (English)
- Sweden (English)
- Switzerland
- United Kingdom (English)