Main Content

plotyy

(Not recommended) Create graph with two y-axes

    plotyy is not recommended. Use yyaxis instead. For more information on updating your code, see Version History.

    Description

    plotyy(X1,Y1,X2,Y2) plots Y1 against X1 with y-axis labeling on the left and plots Y2 against X2 with y-axis labeling on the right.

    example

    plotyy(X1,Y1,X2,Y2,f) uses the specified plotting function to plot the data.

    plotyy(X1,Y1,X2,Y2,f1,f2) uses the plotting function f1 to plot Y1 against X1 and the plotting function f2 to plot Y2 against X2.

    example

    plotyy(ax,___) displays the left plot in the specified axes instead of the current axes. If ax is a vector, then plotyy uses the first axes object in the vector. Specify the axes as the first argument in any of the previous syntaxes.
    [a,p1,p2] = plotyy(___) returns the two axes objects in a and the two graphics objects in p1 and p2. a(1) is the left axes and a(2) is the right axes. Use a, p1, and p2 to modify the properties of the axes and plots after creating them.

    example

    Examples

    collapse all

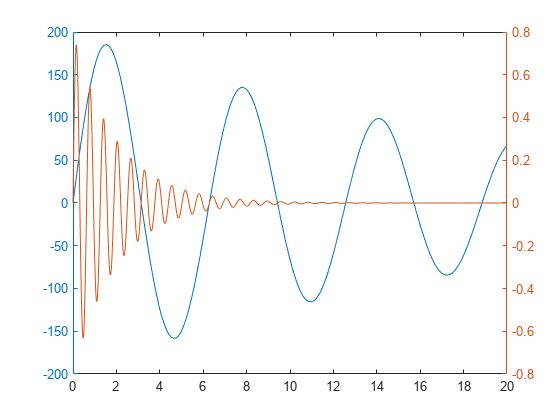
    Plot two data sets on one graph using two y-axes.

    x = 0:0.01:20;
    y1 = 200*exp(-0.05*x).*sin(x);
    y2 = 0.8*exp(-0.5*x).*sin(10*x);
    
    figure
    plotyy(x,y1,x,y2)

    Figure contains 2 axes objects. Axes object 1 contains an object of type line. Axes object 2 contains an object of type line.

    Plot two data sets using a graph with two y-axes. Add a title and axis labels.

    x = 0:0.01:20;
    y1 = 200*exp(-0.05*x).*sin(x);
    y2 = 0.8*exp(-0.5*x).*sin(10*x);
    
    figure
    [hAx,hLine1,hLine2] = plotyy(x,y1,x,y2);
    
    title("Multiple Decay Rates")
    xlabel("Time (\musec)")
    
    ylabel(hAx(1),"Slow Decay") % left y-axis 
    ylabel(hAx(2),"Fast Decay") % right y-axis

    Figure contains 2 axes objects. Axes object 1 with title Multiple Decay Rates, xlabel Time (\musec), ylabel Slow Decay contains an object of type line. Axes object 2 with ylabel Fast Decay contains an object of type line.

    Plot two data sets using a graph with two y-axes. Change the line styles.

    x = 0:0.01:20;
    y1 = 200*exp(-0.05*x).*sin(x);
    y2 = 0.8*exp(-0.5*x).*sin(10*x);
    
    [hAx,hLine1,hLine2] = plotyy(x,y1,x,y2);
    hLine1.LineStyle = "--";
    hLine2.LineStyle = ":";

    Figure contains 2 axes objects. Axes object 1 contains an object of type line. Axes object 2 contains an object of type line.

    Plot two data sets using a graph with two y-axes. Use a line plot for the data associated with the left y-axes. Use a stem plot for the data associated with the right y-axes.

    x = 0:0.1:10;
    y1 = 200*exp(-0.05*x).*sin(x);
    y2 = 0.8*exp(-0.5*x).*sin(10*x);
    
    figure 
    plotyy(x,y1,x,y2,@plot,@stem)

    Figure contains 2 axes objects. Axes object 1 contains an object of type line. Axes object 2 contains an object of type stem.

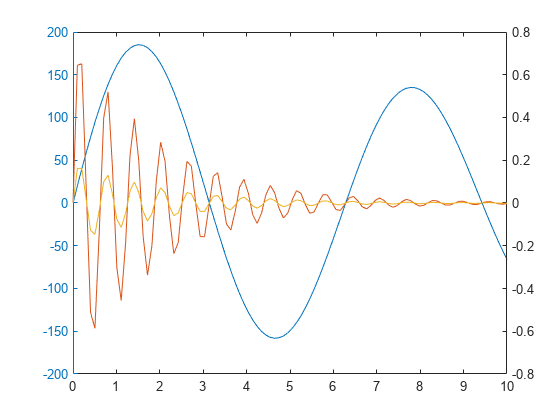
    Plot three data sets using a graph with two y-axes. Plot one set of data associated with the left y-axis. Plot two sets of data associated with the right y-axis by using two-column matrices.

    x = linspace(0,10);
    y1 = 200*exp(-0.05*x).*sin(x);
    y2 = 0.8*exp(-0.5*x).*sin(10*x);
    y3 = 0.2*exp(-0.5*x).*sin(10*x);
    
    figure
    [hAx,hLine1,hLine2] = plotyy(x,y1,[x',x'],[y2',y3']);

    Figure contains 2 axes objects. Axes object 1 contains an object of type line. Axes object 2 contains 2 objects of type line.

    Input Arguments

    collapse all

    x-coordinates, specified as a scalar, vector, or matrix.

    Data Types: single | double | int8 | int16 | int32 | int64 | uint8 | uint16 | uint32 | uint64 | categorical | datetime | duration

    y-coordinates, specified as a scalar, vector, or matrix.

    Data Types: single | double | int8 | int16 | int32 | int64 | uint8 | uint16 | uint32 | uint64 | categorical | datetime | duration

    Plotting function used to plot the data, specified as a function handle or a character vector that is the name of a plotting function, for example, semilogx, semilogy, loglog, stem, or any MATLAB® function that accepts the syntax h = function(x,y).

    Example: plotyy(x1,y1,x2,y2,@loglog)

    Example: plotyy(x1,y1,x2,y2,'loglog')

    Target axes, specified as an Axes object. If you do not specify the axes, MATLAB plots the first set of data into the current axes or creates an Axes object if one does not exist.

    Output Arguments

    collapse all

    Two axes, returned as an array of two Axes objects. a(1) is the left axes and a(2) is the right axes. Use a to modify the properties of the axes.

    Graphics object. Use p to modify the properties of the plot after creating it.

    Extended Capabilities

    expand all

    Version History

    Introduced before R2006a

    collapse all