linkaxes
Synchronize limits of multiple axes
Description
linkaxes(
synchronizes the limits of the
specified vector of axes. Synchronizing limits allows you to zoom or pan in one plot or
figure and display the same range of data in another plot or figure. When you first call
ax
)linkaxes
, the function chooses new limits that incorporate the
current limits of all the specified axes.
Examples
Synchronize and Change Axis Limits
Display a tiling of plots using the tiledlayout
and nexttile
functions.
Create a 3-by-1 tiled chart layout by using the tiledlayout
function. Then, create the axes objects ax1
, ax2
, and ax3
by using the nexttile
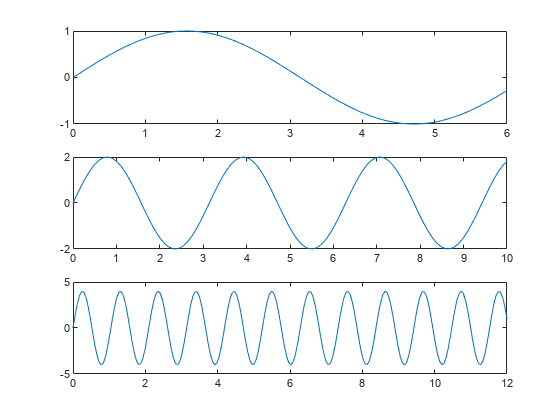
function and plot into each axes.
tiledlayout(3,1) % First plot ax1 = nexttile; x1 = linspace(0,6); y1 = sin(x1); plot(x1,y1) % Second plot ax2 = nexttile; x2 = linspace(0,10); y2 = 2*sin(2*x2); plot(x2,y2) % Third plot ax3 = nexttile; x3 = linspace(0,12,200); y3 = 4*sin(6*x3); plot(x3,y3)
Synchronize the x-axis and y-axis limits of each plot. Note that the new axes limits incorporate the old limits.
linkaxes([ax1 ax2 ax3],'xy')
Set the x-axis limits for the first plot. All of the axes are linked, so the x-axis limits in the second and third plots also change.
ax1.XLim = [0 4.5];
Panning or zooming into one of the plots displays the same range of data in the other two plots.
To remove the linking, use linkaxes([ax1 ax2 ax3],'off')
.
Synchronize and Modify Axes Limits for Specified Dimension
Synchronize and modify the x-axis limits of multiple axes objects by using the linkaxes
function.
Display a tiling of plots using the tiledlayout
and nexttile
functions. Create a 2-by-1 tiled chart layout by using the tiledlayout
function. Then, create the axes objects ax1
and ax2
by using the nexttile
function and plot into each axes.
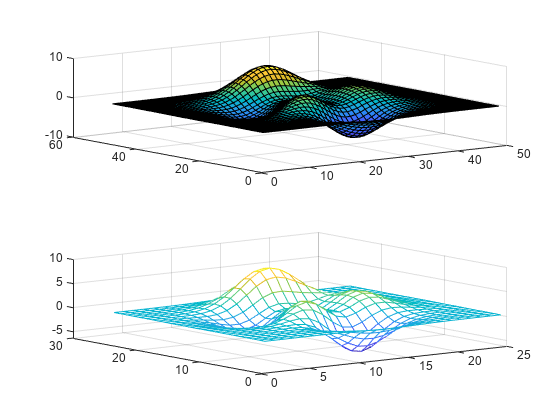
t = tiledlayout(2,1); % First plot ax1 = nexttile; p1 = peaks; surf(ax1,p1); view(3) % Second plot ax2 = nexttile; p2 = peaks(25); mesh(ax2,p2)
Synchronize the x-axis limits for the two axes objects. The x-axis limits for the newly linked axes objects will update to encompass all the data.
linkaxes([ax1 ax2],'x');
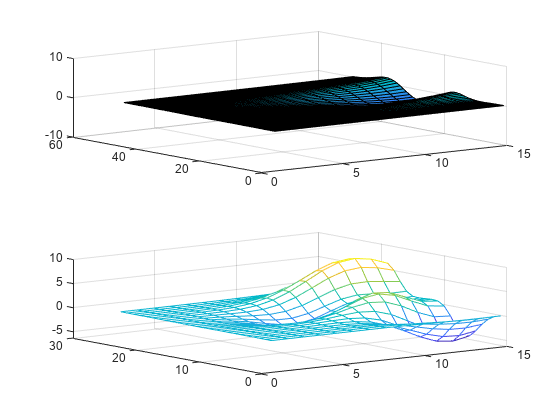
Update the x-axis limits for all linked axes objects by setting the x-axis limits for just one of the axes objects.
ax1.XLim = [0 15]; ax2.XLim
ans = 1×2
0 15
Remove the linking by turning off synchronization.
linkaxes([ax1 ax2],'off');
Synchronize Datetime Plots in Different Time Zones
When comparing two plots of datetime values in different time zones, set the ReferenceDate
property of one of the rulers so that both plots reflect the same time zone.
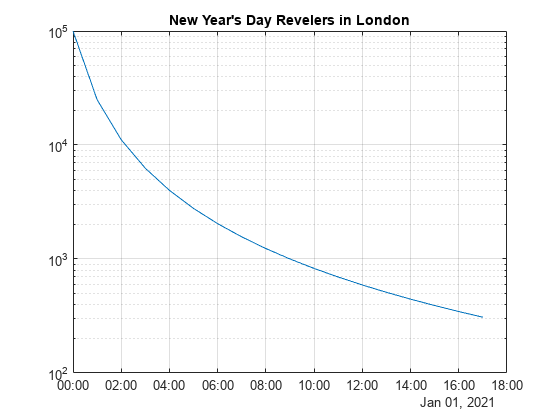
Create a tiling of two plots that compare the number of New Year's Day revelers in London and New York on January 1, 2021. Start by plotting the London
data in the first tile. By default, the plot uses the time zone of the data.
London = datetime(2021,1,1,0:17,0,0,"TimeZone","Europe/London"); y = (1./(1:18).^2) * 100000; ax1 = nexttile; semilogy(ax1,London,y) grid on title("New Year's Day Revelers in London")
Plot the NY
data. This second plot is in the time zone of New York, so you cannot accurately compare the number of revelers across the two locations at the same point in time by visual inspection.
NY = datetime(2021,1,1,0:17,0,0,"TimeZone","America/New_York"); ax2 = nexttile; semilogy(ax2,NY,y) grid on title("New Year's Day Revelers in New York")
Change the time zone for the New York plot by setting the reference date of the x-axis to a datetime value in the time zone of "Europe/London"
. Then link the two axes. As a result, both plots reflect the same time zone.
ax2.XAxis.ReferenceDate = datetime(2022,1,1,"TimeZone","Europe/London"); linkaxes([ax1,ax2],"x")
Input Arguments
ax
— Target axes
vector of Axes
objects
Target axes, specified as a vector of Axes
objects.
You can link any number of Axes
objects. For example,
linkaxes([ax1 ax2 ax3])
links ax1
,
ax2
, and ax3
. Separate calls to
linkaxes([ax1 ax2])
and linkaxes([ax2 ax3])
cancels the link between ax1
and ax2
.
dimension
— Axis limits to synchronize
'xyz'
(default) | 'x'
| 'y'
| 'z'
| 'xy'
| 'xz'
| 'yz'
| 'off'
Axis limits to synchronize, specified as one of these values:
'xyz'
— Synchronize the x-axis, y-axis, and z-axis limits.'x'
— Synchronize only the x-axis limits.'y'
— Synchronize only the y-axis limits.'z'
— Synchronize only the z-axis limits.'xy'
— Synchronize only the x-axis and y-axis limits.'xz'
— Synchronize only the x-axis and z-axis limits.'yz'
— Synchronize only the y-axis and z-axis limits.'off'
— Turn off synchronization.
Version History
Introduced before R2006aR2022a: Link 3-D Cartesian axes
linkaxes
now supports 3-D Cartesian axes. The
x-axis, y-axis, and z-axis limits
are now synchronized by default. You can specify 3-D axis limits to synchronize by using the
dimension
input argument.
Previously, linkaxes
supported only 2-D Cartesian axes and
synchronized the x-axis and y-axis limits by
default.
See Also
linkprop
| linkdata
| tiledlayout
| nexttile
MATLAB Command
You clicked a link that corresponds to this MATLAB command:
Run the command by entering it in the MATLAB Command Window. Web browsers do not support MATLAB commands.
Select a Web Site
Choose a web site to get translated content where available and see local events and offers. Based on your location, we recommend that you select: .
You can also select a web site from the following list
How to Get Best Site Performance
Select the China site (in Chinese or English) for best site performance. Other MathWorks country sites are not optimized for visits from your location.
Americas
- América Latina (Español)
- Canada (English)
- United States (English)
Europe
- Belgium (English)
- Denmark (English)
- Deutschland (Deutsch)
- España (Español)
- Finland (English)
- France (Français)
- Ireland (English)
- Italia (Italiano)
- Luxembourg (English)
- Netherlands (English)
- Norway (English)
- Österreich (Deutsch)
- Portugal (English)
- Sweden (English)
- Switzerland
- United Kingdom (English)
Asia Pacific
- Australia (English)
- India (English)
- New Zealand (English)
- 中国
- 日本Japanese (日本語)
- 한국Korean (한국어)