yyaxis
Create chart with two y-axes
Description
yyaxis left activates the side of the current axes associated with the
left y-axis. Subsequent graphics commands target the left
side. If the current axes do not include two y-axes, then
this command adds a second y-axis. If there are no axes,
then this command first creates them.
yyaxis right activates the side of the current axes associated with the
right y-axis. Subsequent graphics commands target the right
side.
Examples
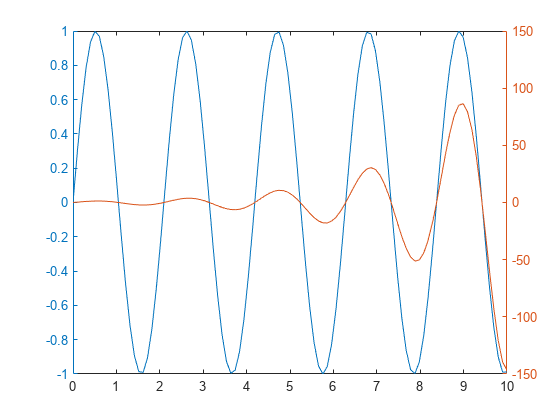
Create axes with a y-axis on both the left and right sides. Plot a set of data against the left y-axis. Then, use yyaxis right to activate the right side so that subsequent graphics functions target it. Plot a second set of data against the right y-axis and set the limits for the right y-axis.
x = linspace(0,10);
y = sin(3*x);
yyaxis left
plot(x,y)

z = sin(3*x).*exp(0.5*x);
yyaxis right
plot(x,z)
ylim([-150 150])
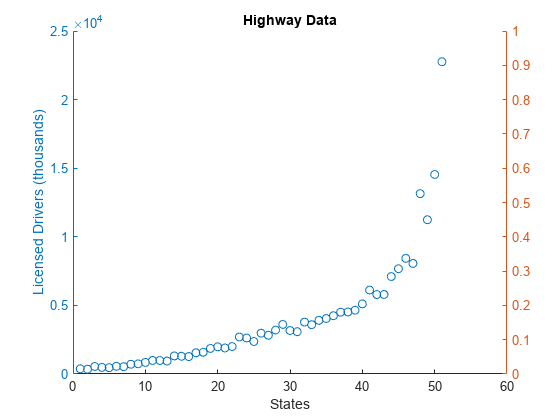
Create a chart with two y-axes and add a title and axis labels to each side.
Load the matrix hwydata from the example file accidents.mat. Create a scatter plot of the fifth column in hwydata against the left y-axis. Add a title and axis labels.
load('accidents.mat','hwydata')
ind = 1:51;
drivers = hwydata(:,5);
yyaxis left
scatter(ind,drivers)
title('Highway Data')
xlabel('States')
ylabel('Licensed Drivers (thousands)')
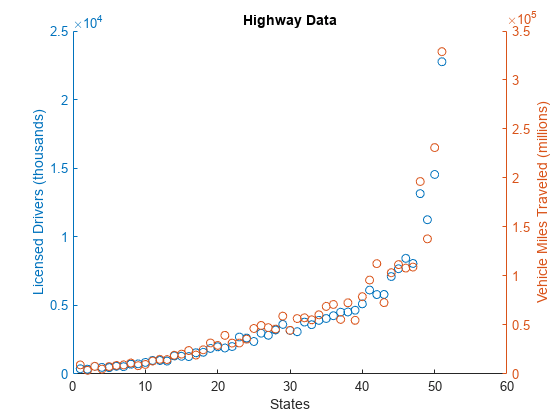
Create a second scatter plot of the seventh column in hwydata against the right y-axis. Then, label the right y-axis.
pop = hwydata(:,7);
yyaxis right
scatter(ind,pop)
ylabel('Vehicle Miles Traveled (millions)')
Plot two lines against the left y-axis by using the hold on command.
x = linspace(0,10);
yl1 = sin(x);
yl2 = sin(x/2);
yyaxis left
plot(x,yl1)
hold on
plot(x,yl2)
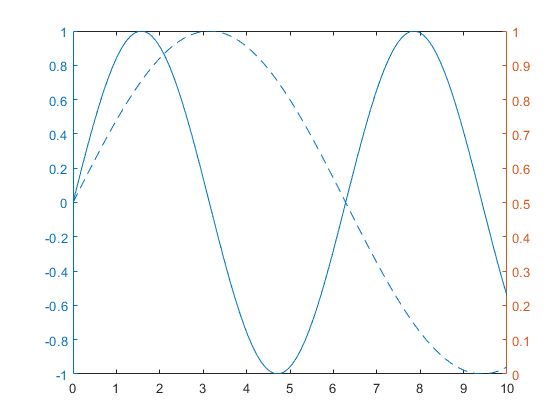
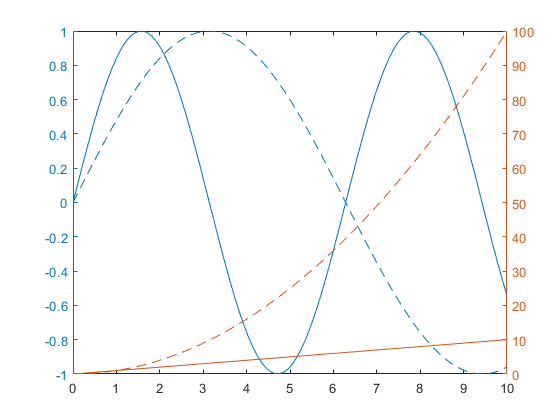
Plot two lines against the right y-axis. The hold command affects both the left and right y-axes, so you do not need to reissue it. After plotting, turn hold back off.
yr1 = x;
yr2 = x.^2;
yyaxis right
plot(x,yr1)
plot(x,yr2)
hold off
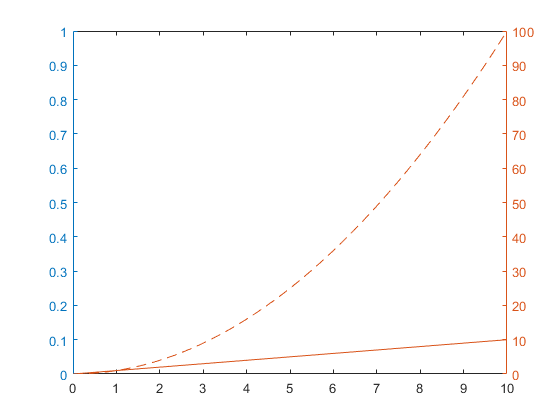
Clear the left side by making it active and then using the cla command.
yyaxis left
cla
Specify the color scheme for each side of the axes by setting the color order to the two colors that you want to use. Starting in R2019b, you can use the colororder function to set the color order. Then, plot two lines against the left y-axis and two lines against the right y-axis. Add a legend.
colororder({'b','m'})

yyaxis left
y = [1 2; 3 4];
plot(y)

yyaxis right
z = [4 3; 2 1];
plot(z)
legend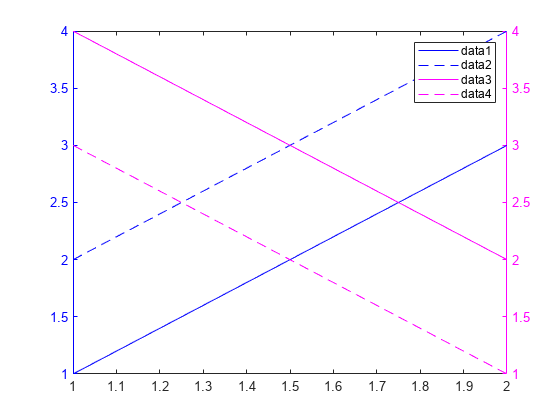
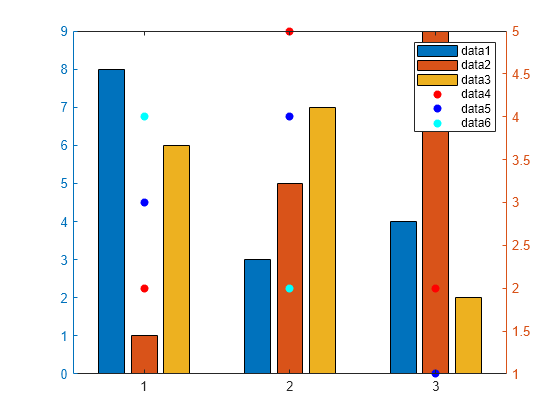
Control individual plot colors by setting the color order for each side of the axes.
Plot three bar charts against the left side. Use a different color for each bar series by setting the color order for the left side to the default color order.
yyaxis left
bar(magic(3));
colororder('default')
Plot three scatter plots against the right side. Use a different color for each scatter plot by setting the color order to an array of color names. Alternatively, you can specify the colors using a matrix of RBG triplets. Then add a legend.
yyaxis right
scatter([1 2 3],[2 5 2],'filled')
hold on
scatter([1 2 3],[3 4 1],'filled')
scatter([1 2 3],[4 2 4],'filled')
hold off
colororder({'r','b','c'})
legend
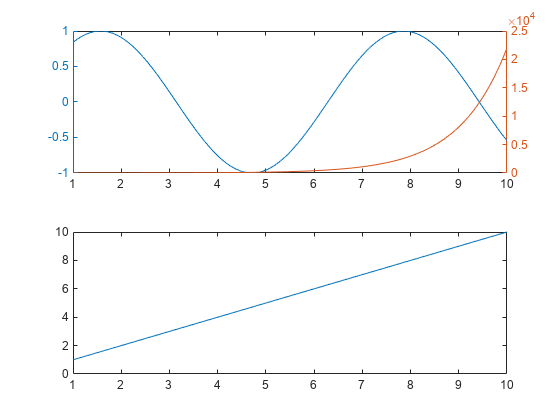
Starting in R2019b, you can display a tiling of plots using the tiledlayout and nexttile functions. Call the tiledlayout function to create a 2-by-1 tiled chart layout. Call the nexttile function to create the axes objects ax1 and ax2. Add a second y-axis to the top axes by specifying ax1 as the first input to yyaxis. If you do not specify the axes, then yyaxis adds a second y-axis to the current axes.
x = linspace(1,10);
tiledlayout(2,1)

% Top plot
ax1 = nexttile;
yyaxis(ax1,'left')
plot(ax1,x,sin(x))
yyaxis(ax1,'right')
plot(ax1,x,exp(x))

% Bottom plot
ax2 = nexttile;
plot(ax2,1:10)
Input Arguments
Limitations
When working with two y-axes, you cannot:
Rotate the axes (2-D view only).
Pin annotations.
Copy the axes object using
copyobj.
Tips
To determine which side of the axes is active, query the
YAxisLocationproperty for theAxesobject. The property is set to'left'when the left side is active and'right'when the right side is active. TheYAxisLocationproperty for anAxesobject with two y-axes is read only.To clear the active side, use
cla. To clear both sides of the axes and remove the right y-axis, usecla reset. Alternatively, you can wait to clear both sides and remove the right y-axis until the next plotting command by setting theNextPlotproperty of theAxesobject to'replaceall'.The
Childrenproperty of theAxesobject only contains the children for the active side. To access all the children for both sides, use theallchildfunction.
Algorithms
Version History
Introduced in R2016a