probplot
R2026bDescription
probplot( creates a scatter plot of
failure probability versus failure time for the stressor levels
mdl)mdl.StressorLevels in the AcceleratedLifeModel object mdl. The
probplot function plots each row in
mdl.StressorLevels using marker symbols, and draws a reference line for
each unique stressor level. The reference line connects the first and third quartiles of the
failure time data for that stressor level and extends to the ends of the data.
For you to create a probability plot, mdl.StressorLevels must have
more than one row for each unique stressor level.
h = probplot(___)h) to the reference lines in the probability plot, using any
of the input argument combinations in the previous syntaxes.
Examples
Load the diodeFailure data set, which contains simulated observations of failure times for a diode at different current levels.
load diodeFailure.matFit an accelerated life model to the data in the diodeFailure table using the fitacclife function. Use the FailureTime table variable as the failure times.
mdl = fitacclife(diodeFailure,"FailureTime")mdl =
AcceleratedLifeModel
Life distribution: weibull
Stress model: arrhenius
Current WeibullA MeanFailureTime
_______ ________ _______________
10 1.5323 1.4721
5 2.4956 2.3975
3 4.7821 4.5941
Log-likelihood: 0.4676
mdl is an AcceleratedLifeModel object, which contains information about the fitted model coefficient estimates. By default, the fitacclife function fits an Arrhenius life stress model to the data, using a Weibull life distribution. The first column of the displayed output contains the unique stressor levels in diodeFailure. The second and third columns contain the fitted life distribution coefficient values and mean failure times, respectively.
Create a probability plot.
probplot(mdl)
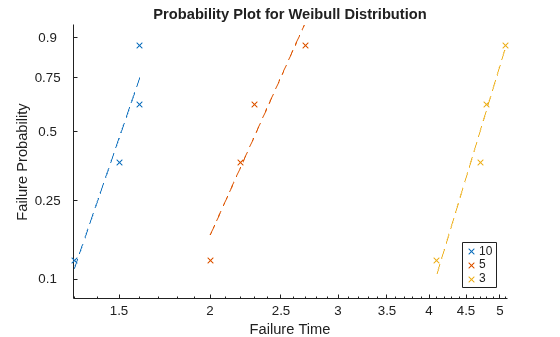
The log-log scatter plot of failure probability versus failure time shows each observation in the data, grouped by stressor level. The dashed lines are linear regression fits to the failure times belonging to each group.
The plot indicates that failure times are shorter at higher current levels, and that the failure probability increases nonlinearly with time at each stressor level.
Input Arguments
Version History
Introduced in R2026a
See Also
fitacclife | AcceleratedLifeModel | accelfactor | coefci | distfcn | distplot | icdf | meanfailplot | meanfailtime

