meanfailplot
Syntax
Description
meanfailplot( plots the failure times
mdl)mdl.FailureTimes versus the stressor levels
mdl.StressorLevels in the AcceleratedLifeModel object mdl. If
mdl contains one stressor, the function creates a scatter plot of the
data and a line representing the fitted mean failure times. If mdl
contains two stressors, the function creates a 3-D scatter plot of the data and a surface
that represents the fitted mean failure times.
To return the mean failure times, use the meanfailtime
function.
meanfailplot(___,BaselineStressorLevel=
adds a plot marker on the fitted model line or surface at the stressor level
baseline)baseline, using any of the input argument combinations in the
previous syntaxes. The number of elements in baseline must equal the
number of stressors in mdl.
meanfailplot( uses the plot
axes specified by the ax,___)Axes object ax. The option
ax can precede any of the input argument combinations in the previous
syntaxes.
h = meanfailplot(___)h) to the fitted line or surface in the mean failure time
plot.
Examples
Load the diodeFailure data set, which contains simulated observations of failure times for a diode at different current levels.
load diodeFailure.matFit an accelerated life model to the data in the diodeFailure table using the fitacclife function. Specify a power law life stress model and use the FailureTime table variable as the failure times.
mdl = fitacclife(diodeFailure,"FailureTime",StressModel="power")
mdl =
AcceleratedLifeModel

Life distribution: weibull
Stress model: power

    Current    WeibullA    MeanFailureTime
    _______    ________    _______________

      10        1.4869           1.41
       5        2.8445         2.6973
       3         4.588         4.3506


Log-likelihood: -3.6697
mdl is an AcceleratedLifeModel object, which contains information about the fitted model coefficient estimates. By default, the fitacclife function uses a Weibull life distribution. The first column of the displayed output lists the unique stressor levels in diodeFailure. The second and third columns list the fitted life distribution values and mean failure times, respectively.
Use the meanfailtime function to compute the predicted mean failure time and the Weibull life distribution parameter at current levels 12 and 15.
[meanFailTimes,lifeCoeffs] = meanfailtime(mdl,[12; 15])
meanFailTimes=2×2 table
    Current    MeanFailureTime
    _______    _______________

      12            1.1888
      15           0.96474
lifeCoeffs=2×2 table
    Current    WeibullA
    _______    ________

      12        1.2537
      15        1.0174
Create a plot of failure time versus current level.
meanfailplot(mdl)
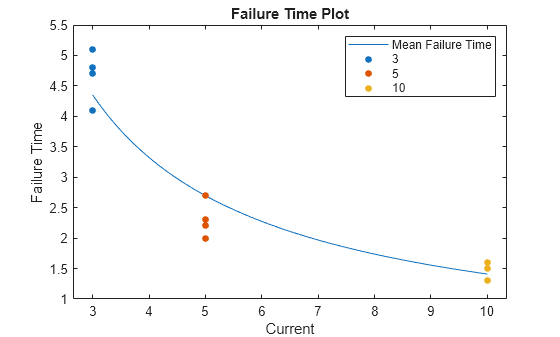
The plot shows that the mean failure time decreases nonlinearly with increasing current level.
Input Arguments
Output Arguments
Version History
Introduced in R2026a
See Also
fitacclife | AcceleratedLifeModel | accelfactor | coefci | distfcn | distplot | icdf | meanfailtime | probplot