Transition Between Operating Modes
A transition represents the passage of a reactive system from one operating mode to another. In a Stateflow® chart, a transition is a line with an arrowhead that typically connects two states. The source of the transition is the state where the transition begins and the destination of the transition is the state where the transition ends.
You can also create a transition path with more than one transition segment by using connective junctions. For example, you can create a transition path from a single source to multiple destinations or from multiple sources to a single destination. In this case, any intermediate transitions have a connective junction as a source or destination. For more information, see Combine Transitions and Junctions to Create Branching Paths.
A default transition is a special type of transition that has no source. In charts or states with exclusive (OR) decomposition and at least two substates, there must be a default transition path that is not guarded by a condition or triggered by an event. In the absence of history junctions, default transitions indicate the first substate to become active when the chart or superstate becomes active. For more information, see Use Default Transitions to Specify Initial Substate Activity for details.
For example, the states in this chart represent the operating modes of an air controller
system with two fans. The transitions between the states PowerOn and
PowerOff represent the change of mode as the air controller system turns
on and off. The default transition to the state PowerOff indicates that the
system is off when the chart wakes up at the start of the simulation. Similarly, in the states
FAN1 and FAN2, the transitions between the substates
represent the change of mode as each fan turns on and off and the default transition indicates
that the fans are off when the superstate PowerOn becomes active. For more
information on this example, see Execute States in Parallel.

The parent of a transition is the lowest level state or chart that contains the source and
destination of the transition. For instance, in the previous example, FAN1
is the parent state of the transitions between the substates FAN1.On and
FAN1.Off. Similarly, FAN2 is the parent state of the
transitions between the substates FAN2.On and FAN2.Off.
In contrast, the parent of the transitions between the states PowerOn and
PowerOff is the chart itself.
Create a Transition
You can add a transition to a new or existing destination.
Point to the border of the source state or junction. The pointer changes to a crosshair.
Click and drag away from the source state or junction. The Stateflow Editor provides graphical cues that allow you to add a junction or a state.
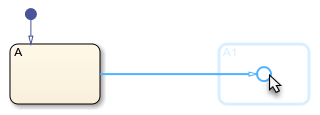
Select a destination for the new transition:
To add a new state at the end of the transition, click the rectangular cue.
To add a new junction at the end of the transition, click the circular cue.
To connect the transition to an existing state or junction, drag the pointer to the desired destination.
Enter a label for the transition and click away from the transition. The label specifies the conditions and triggers that make the transition valid, as well as any actions that the transition executes during simulation. For more information, see Define Actions in a Transition.
After you create a transition, you can use the Stateflow Editor to change the shape, source, destination, or label of the transition:
To reshape the transition, click and drag the midpoint of the transition.
To change the source or destination, click and drag an endpoint of the transition.
To edit the transition label, click the label text near the character position you want to edit. If your transition has an empty label, first select the transition.
To move the transition label, click and drag the label.
Create a Default Transition
In the object palette, click the Default transition icon
 .
.On the chart canvas, click a side of the destination state or junction.
Optionally, add a label for the default transition.
Tip
The size of the endpoint of the default transition is proportional to the arrowhead size. See Change Transition Arrowhead Size.
Define Actions in a Transition
The label for a transition specifies an event or message trigger and a condition that makes the transition valid, as well as a condition action and a transition action that the transition executes during simulation. Transition labels have this general format:
trigger[condition]{condition_action}/{transition_action}Each part of the label is optional and can appear on a separate line. For more information on how the chart uses labels to determine the validity of transitions, see Evaluate Transitions.
Event and Message Triggers
A transition label starts with the name of an event or message that triggers the
transition. To specify multiple event or message triggers, use the logical OR
(|) operator.
A transition with an event trigger is valid only when the chart receives a broadcast of the specified event. A transition with a message trigger is valid only when the specified message is present in the message queue. For more information, see Synchronize Model Components by Using Events and Communicate with Stateflow Charts by Sending Messages.
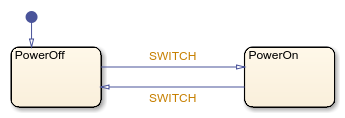
For example, in this chart, the transitions between states PowerOff
and PowerOn have event triggers. These transitions are valid when the
source state is active and the chart receives a broadcast of the input event
SWITCH.
Tip
You can use implicit events (such as change, enter, or exit) and temporal logic operators (such as after, at, before, or every) to trigger transitions. For more information, see
Control Chart Behavior by Using Implicit Events and Control Chart Execution by Using Temporal Logic.
Conditions
To add a condition to a transition label, enter a Boolean expression enclosed in
square brackets ([]). Follow these guidelines for defining conditions:
The condition expression must be a Boolean expression that evaluates to
true(1) orfalse(0).To combine multiple Boolean expressions, use the logical AND (
&&) and OR (||) operators.To enter the condition expression on more than one line, use an ellipsis (
...).The condition expression can call graphical functions, truth table functions, MATLAB® functions, or Simulink® functions that return a numeric value. However, the function must not modify any data values or cause the chart to change state.
Do not use assignment statements in condition expressions.
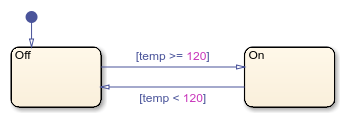
A transition with a condition is valid only when the specified expression is true. For
example, in this chart, the transitions between substates Off and
On have conditions that compare the value of the chart input
temp to a threshold. These transitions are valid when the source
state is active and the condition is true.
Condition Actions
The chart executes a condition action as soon as it determines that the transition is
valid. To add a condition action, after the condition, enter one or more statements
enclosed in braces ({}). To separate multiple statements, use a comma
or a semicolon. Alternatively, you can enter each statement on a separate line. To enter a
single statement on more than one line, use an ellipsis (...).
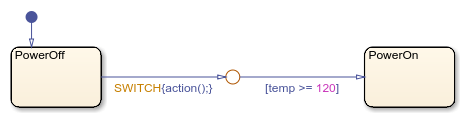
If the transition is part of a transition path that consists of multiple segments,
that chart executes the condition action before it evaluates any subsequent segments of
the transition path. For example, this chart contains a transition path with two
transition segments. When the chart receives a broadcast of the input event
SWITCH, the chart executes the condition action on the first
transition segment regardless of whether the second transition segment is valid. For more
information, see Control Chart Execution by Using Condition Actions.
Transition Actions
The chart executes a transition action when it determines that the entire transition
path is valid. To add a transition action, after the condition action, enter a forward
slash (/) followed by one or more statements enclosed in braces
({}). To separate multiple statements, use a comma or a semicolon.
Alternatively, you can enter each statement on a separate line. To enter a single
statement on more than one line, use an ellipsis (...).
If the transition is part of a transition path that consists of multiple segments,
that chart executes the transition action after it determines that there is a sequence of
valid segments to a destination state or a terminal junction. For example, this chart
contains a transition path with two transition segments. When the chart receives a
broadcast of the input event SWITCH, the chart executes the transition
action on the first transition segment only if the second transition segment is valid. For
more information, see Evaluate Outer Transitions with Condition and Transition Actions.

Tip
In charts that use C as the action language, you do not have to enclose transition actions in braces. In charts that use MATLAB as the action language, the syntax is automatically corrected if the braces are missing from the transition action.
Change Transition Arrowhead Size
To adjust the size of the arrowhead on a transition:
Right-click the transition.
Select Arrowhead Size.
Choose an arrowhead size from the drop-down list.
Alternatively, you can adjust the arrowhead size of more than one transitions at the same time.
Select multiple transitions.
Right-click one of the selected transitions.
Select Format > Arrowhead Size.
Choose an arrowhead size from the drop-down list.
Changing the arrowhead size on a transition also changes the arrowhead size of the other transitions with the same destination.
Specify Properties for Transitions
The properties listed below enable you to specify how a transition interacts with the other components in your Stateflow chart. You can modify these properties in the Property Inspector, the Model Explorer, or the Transition properties dialog box.
To use the Property Inspector:
In the Modeling tab, under Design Data, select Property Inspector.
In the Stateflow Editor, select the transition.
In the Property Inspector, edit the transition properties.
To use the Model Explorer:
In the Modeling tab, under Design Data, select Model Explorer.
In the Model Hierarchy pane, select the parent state or chart for the transition.
In the Contents pane, select the transition.
In the Dialog pane, edit the transition properties.
To use the Transition properties dialog box:
In the Stateflow Editor, right-click the transition.
Select Properties.
In the properties dialog box, edit the transition properties.
You can also modify transition properties programmatically by using Stateflow.Transition objects. For more information about the Stateflow programmatic interface, see Overview of the Stateflow API.
Source
Source of the transition. This property is read-only and is not available in the Property Inspector. When you click the source hyperlink, the Stateflow Editor brings the transition source to the foreground.
Destination
Destination of the transition. This property is read-only and is not available in the Property Inspector. When you click the destination hyperlink, the Stateflow Editor brings the transition destination to the foreground.
Parent
Parent of the transition. This property is read-only and is not available in the Property Inspector. When you click the parent hyperlink, the Stateflow Editor brings the parent to the foreground.
Execution order
Execution order for the transition. For more information, see Transition Evaluation Order.
Treat as variant transition
Whether the transition is a variant transition. For more information, see Control Indicator Lamp Dimmer Using Variant Conditions.
Label
The label for the transition. This property is not available in the Property Inspector. For more information, see Define Actions in a Transition.
Description
Description of the transition.
Document link
Link to online documentation for the transition. You can enter a web URL address or a MATLAB command that displays documentation as an HTML file or as text in the MATLAB Command Window. When you click the Document link hyperlink, Stateflow evaluates the link and displays the documentation.
See Also
Objects
Tools
- Model Explorer (Simulink)
Topics
- Represent Operating Modes by Using States
- Combine Transitions and Junctions to Create Branching Paths
- Control Chart Execution by Using Condition Actions
- Synchronize Model Components by Using Events
- Communicate with Stateflow Charts by Sending Messages
- Use Default Transitions to Specify Initial Substate Activity
- Control Chart Execution by Using Inner Transitions