Optimize the Generated Code
To help meet your code efficiency goals, Embedded Coder® provides different optimization methods that you can apply depending on your generated code and your deployment goals. Once you generate code that meets your functional requirements, assess the code against your efficiency requirements and choose how to further optimize the code. You can then regenerate the code, assess the performance again, and iterate on the process until the code meets your efficiency requirements.
Assess Memory Usage by Using Static Code Metrics
To check if the generated code meets your memory requirements, use the static code metrics report. The code generator performs static analysis of the generated code and reports metrics such as memory usage, lines of code, and complexity. Use the metrics to identify areas for further memory optimization.
To assess the static code metrics:
If you have not already done so, follow the steps in the previous part of the workflow, Call Existing Code from a Model and Generated Code, or run the script.
openExample("EvPowertrainController")
CCallerEvPowertrainModel
When you generate the code from the model
EvPowertrainController, the code generator analyzes the code and produces static code metrics because the Generate static code metrics parameter is selected.Open the code generation report. From the model
EvPowertrainController, on the C Code tab, click Open Report.In the Content panel on the left, click Static Code Metrics Report.
The report contains sections for metrics on the generated code files, global variables, and functions.
Navigate to the Global Variables section of the report. Expand the row for
EvPowertrainController_Params, which has the largest size.The variable
efficiency_tableuses 1440 bytes, which is much more memory than the other variables use.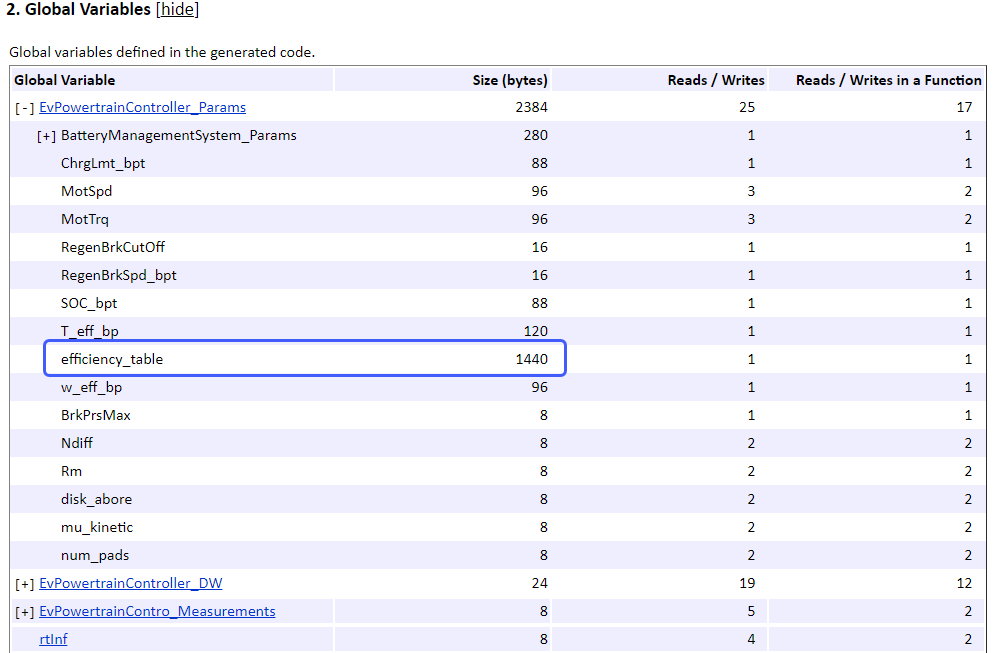
In the table, click the link
EvPowertrainController_Params. The code generation report displays the generated code fileEvPowertrainController.cand navigates to the variable.Navigate to the code that defines
efficiency_table. The comment includes traceability information indicating that the variable corresponds to the block<S12>/Eff Mapin the model.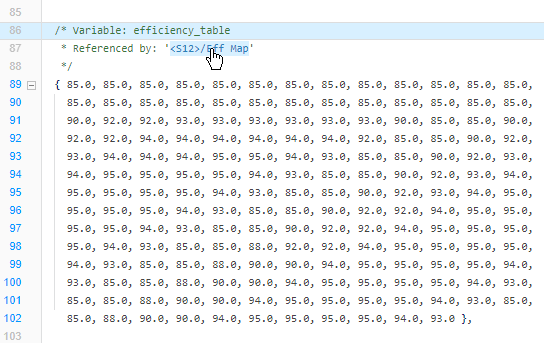
Click the traceability link to find the associated block in the model. For this example, the variable corresponds to the Lookup Table block
Eff Map. If you want to reduce the memory used by the generated variable, you can consider optimizing the lookup table used by the block.
Depending on the variable, function, or code file, consider the available optimization techniques described in Optimize the Generated Code. Then re-generate the code, review the updated code metrics, and repeat this process until the code meets your memory usage requirements.
Assess Code Execution Efficiency by Running SIL and PIL Simulations
To check if your code meets execution time efficiency requirements, run software-in-the-loop (SIL) and processor-in-the-loop (PIL) simulations that collect code execution profiling data. Use the profiling data to focus on optimizing the most critical code sections. Trace those code sections to the associated parts of the model to make adjustments.
Set Up a Harness Model
This example uses a harness model to load the test data and input it to the component model.
Open the model
EvPowertrainHarness. This harness model uses a basic scheduler in a Stateflow® chart to simulateEvPowertrainController, which it references by using a Model block.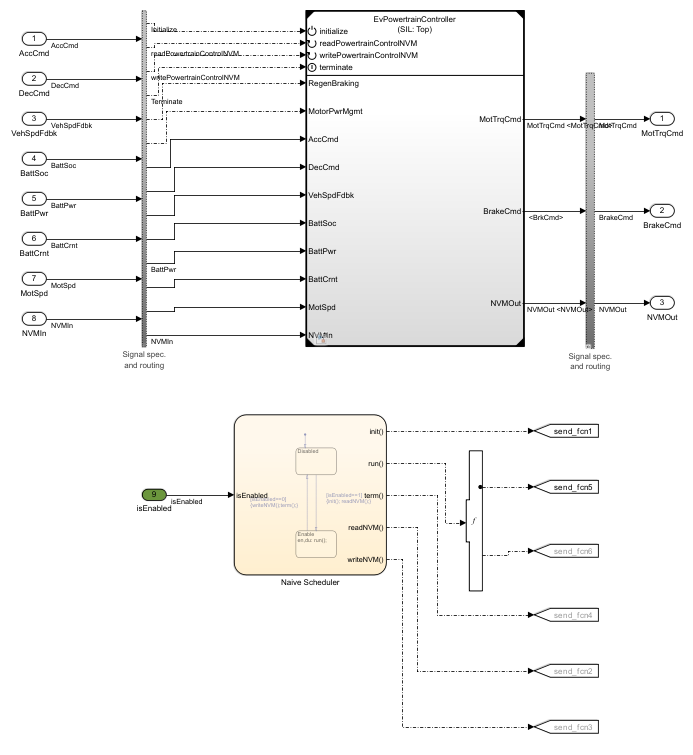
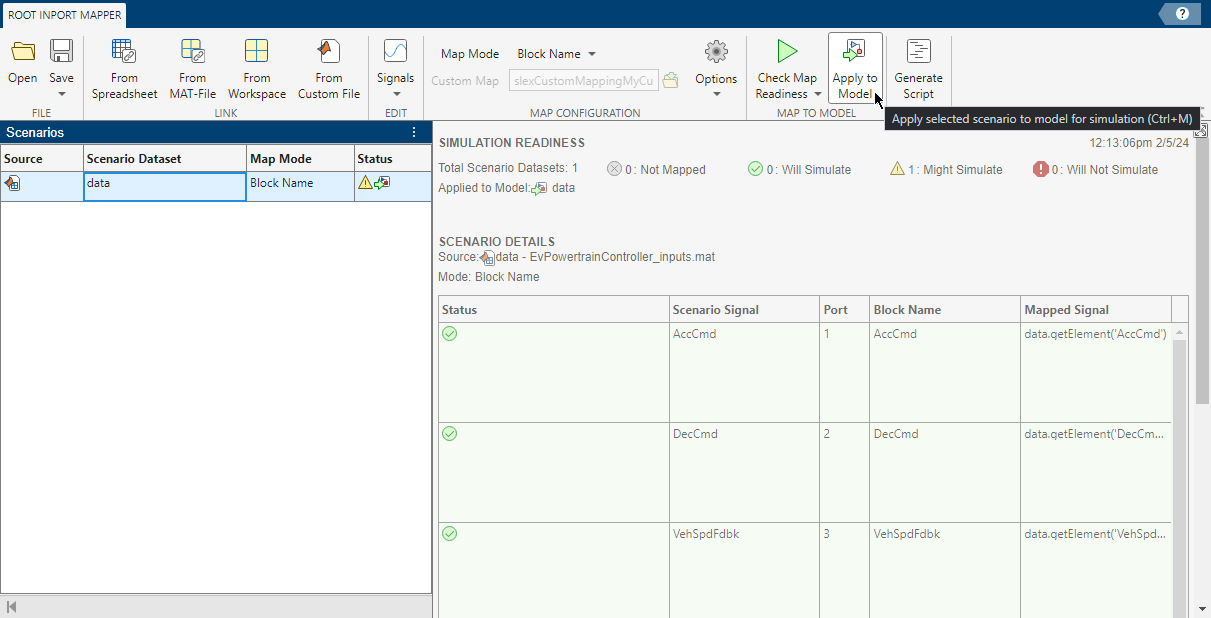
Map the test data from
harness_inputs_scenario.mldatxto the inputs of the harness model. On the Simulation tab, expand the Prepare section and click Connect Inputs.In the Root Input Mapper, click Open. Select the file
harness_inputs_scenario.mldatxand click Open.In the Scenarios panel, select the data set. Then click Apply to Model.
Run SIL Simulation
Gather execution-time metrics by running a SIL simulation using these steps:
Open the model
EvPowertrainHarness. This harness model uses input data from the scenarioharness_inputs_scenario.mldatxto simulateEvPowertrainController, which it references by using a Model block.Open the SIL/PIL Manager app.
On the SIL/PIL tab, confirm these SIL simulation settings:
Mode —
SIL/PIL
                                                  Only
System Under Test —
Model blocks in SIL/PIL
                                                  mode
Top Model Mode —
Normal
To collect execution profiling data during the SIL simulation, in the Settings drop-down list, confirm these settings:
Task Profiling — Selected
Functions —
DetailedCoverage Collection —
OFF
Click the Run SIL/PIL button. The code generator generates code from the models that are running in SIL mode, which are
EvPowertrainControllerand its referenced modelBattery_Management_System. The simulation runs by executing the generated code.When the simulation finishes, double-click the Model block for
EvPowertrainController. The Code view opens to the right of the canvas, showing the generated code and the code execution profiling data from the simulation.To see high-level profiling data, see the Task Profiling Summary table below the code.
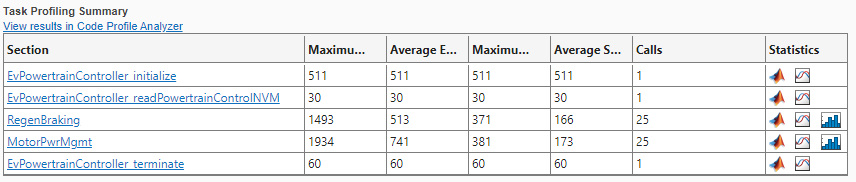
In the Code view, find the line that contains this code:
EvPowertrainController_Y.MotTrqCmd = look1_binlcapw
The code profiling data to the left of the line number indicates the average execution time and number of calls for the code line.
Place your cursor over the variable
EvPowertrainController_Y. The tooltip shows more detailed code profiling data, including the maximum and average execution time, maximum and average self time, number of calls, and links to more detailed statistics.
In the Code view, on the same line, place your cursor on the call
look1_binlcapw. In the tooltip, click the model element<S7>/MaxMorTrqVsSpd. The model navigates into the subsystem Accel Pedal to Traction Wheel Torque Request and highlights the lookup tableMaxMorTrqVsSpd.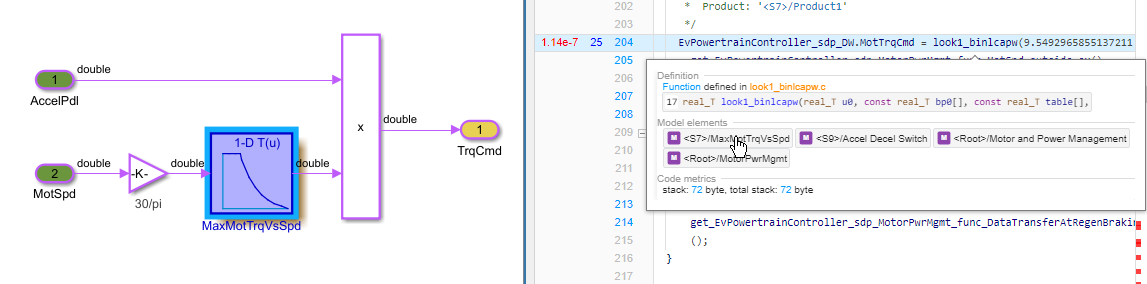
To improve the execution efficiency of this line of code, you would consider changes that you could make to the lookup table.
Depending on the code and the associated model element, consider the available optimization techniques described in Optimize the Generated Code. Then rerun the SIL simulation, review the updated profiling results, and repeat this process until the code meets your execution efficiency requirements.
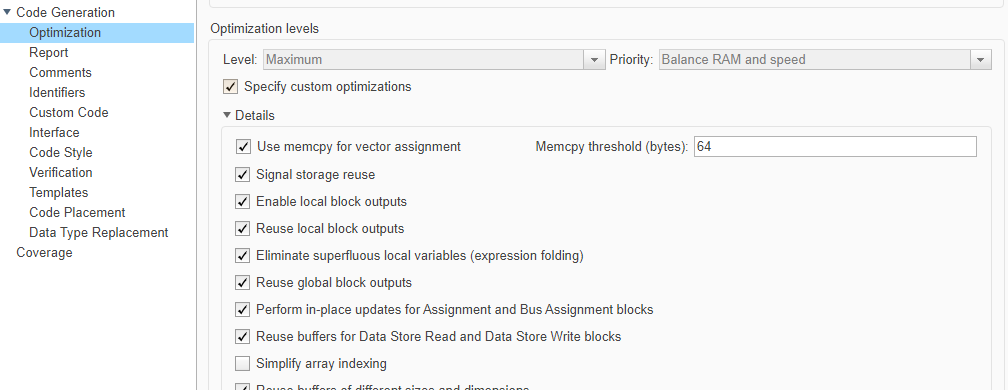
Optimize the Generated Code
When you configured the code generation models in Configure Basic Code Generation Settings, you specified an optimization level and priority for the generated code, which automatically applies optimization settings. To further optimize the generated code for your use case, you can customize the optimization options by selecting the parameter Specify custom optimizations and manually changing the optimization settings under Details.
In addition to the configuration parameters, Embedded Coder offers many different methods of optimizing the generated code for different needs. This table shows some common optimization goals and the techniques that you can use to achieve them.
| Goal | Optimization Technique | Links |
|---|---|---|
| Assess the generated code efficiency alongside the model and make adjustments in the model. | Enable and use traceability between the model and the generated code. | |
| Refactor the design of a model to optimize the generated code. | ||
| Optimize the memory usage of the generated code. | Many techniques, including control of variable definitions, data copy reduction, removal of code that does not impact computation results, and more. | |
| Improve code execution speed. | Many techniques, including variable data control, data copy reduction, parallelization, and many processor-specific optimizations. | |
| Replace generated C functions and operators with calls to hardware-specific optimized functions. | Create and apply a code replacement library (CRL). | |
| Generate code for high-throughput computing applications. | Improve the execution speed of the generated code by generating Open Multiprocessing (OpenMP) and SIMD code. | High-Throughput Computing Applications |