What Is an S-Parameter?
S-parameters (also called S-matrix or scattering parameters) represent the linear characteristics of RF electronic circuits and components. From the S-parameter matrix, you can calculate characteristics of linear networks such as gain, loss, impedance, phase group delay, and voltage standing wave ratio (VSWR).
S-parameters can be easily imported, visualized, and analyzed in MATLAB® using RF Toolbox™.
The S-parameter matrix describes networks with an arbitrary number of ports. It provides a relationship between the incident wave and the reflected and transmitted waves at each port over a range of frequencies. For example, for a two-port device, a four-element matrix of S-parameter data represents the bidirectional behavior of the network as a function of frequency as shown in Figure 1:
- S11 = input port reflection
- S12 = reverse gain
- S21 = forward gain (linear gain/insertion loss)
- S22 = output port reflection

Figure 1. S-parameter matrix of a two-port RF device.
In this example, S11 is defined as the ratio of the reflected wave to the incident wave at port-1 while port-2 is terminated on the characteristic impedance. The value of S11 provides a direct measure of the port matching condition, that is, S11= 1 represents an open circuit; S11= -1 represents a short circuit; and S11= 0 represents a perfectly matched circuit.
Benefits of Using S-Parameters
Easier to measure than Y or Z matrices: The measurement of Y- or Z-parameters requires open- and short-circuit terminations that are challenging to maintain at RF and microwave frequencies, therefore their measurement is less reliable than S-parameters.
Flexible: For circuit analysis or simulation, S-parameters can be easily converted to Z-parameters, Y-parameters, and other linear matrices.
Portable: S-parameters are often stored in a standard file format called Touchstone®. Most RF analysis tools and simulators can read and write Touchstone files, thus making them a portable file format to exchange measurements and design information.

Figure 2. Amplitude characteristics (in dB) of two-port S-parameters describing a SAW filter as a function of frequency. RF Toolbox is used to import and visualize the Touchstone file “SAWfilter.s2p.”
Measuring and Visualizing S-Parameters with MATLAB
S-parameters are measured using vector network analyzers (VNAs) over different operating conditions. As a result, RF test engineers must often process a large amount of S-parameter data. Typical tasks include de-embedding, cascading, and visualizing S-parameters.
RF Toolbox and Instrument Control Toolbox™ allow you to combine S-parameter measurements and data analysis. Automated workflows enable scale-up testing, validating scenarios, extracting statistical information on device performance, and easily sharing results with customers and colleagues.
S-parameter data can also be analytically calculated for a given component prior to its realization via behavioral models, circuit analysis, and electromagnetic simulation, as offered, for example, by Antenna Toolbox™ and RF PCB Toolbox™.
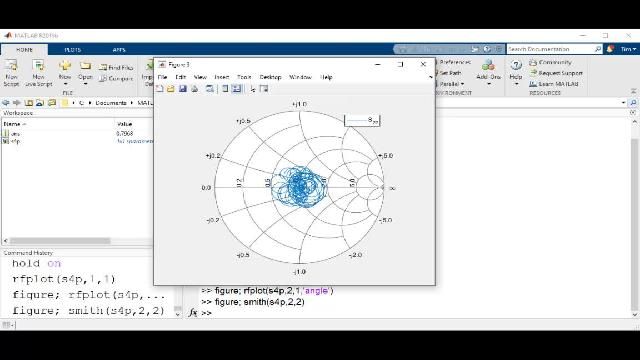
Visualization is the first step for inspecting S-parameter data. The elements of the S-parameter matrix are complex and can be visualized on a Cartesian plot in terms of magnitude and phase or on a polar plot. The Smith chart is a special polar plot format often used for the design of matching networks and for stability analysis.

Figure 3. Smith plot of the S-parameters of a SAW filter as a function of frequency. RF Toolbox is used to import and visualize the Touchstone file “SAWfilter.s2p.” A marker positioned on S22 returns the equivalent output impedance and voltage standing wave ratio.
Fitting S-Parameters with MATLAB
Fitting S-parameters—and general frequency-domain data—with rational functions such as Laplace transfer functions is often used for circuit analysis and for extracting equivalent pole-zero representations.
For example, using rational functions enables time-domain simulation of S-parameters to estimate step and impulse responses. The use of Laplace transfer functions in place of S-parameters also aids in enforcing causality and creating reduced order models.
Using the function rational, you can fit S-parameters and general frequency-domain data with an equivalent Laplace transfer function, which can then be used for circuit analysis and time-domain simulation. This is particularly convenient for extracting equivalent circuit representations of RF components, the analysis of signal integrity problems, and the design of SerDes equalizers.

Using S-parameter data for modeling CTLE in SerDes Toolbox.
Using S-Parameters for Signal Integrity Analysis with MATLAB
S-parameter data can be used in Signal Integrity Toolbox™ to describe n-port channels in high-speed digital interconnects to characterize the effects of impedance mismatches, reflections, losses, dispersion, and crosstalk.
Signal Integrity engineers use S-parameters to model the channel, including PCB traces and vias, connectors, and packages. Typical tasks include changing the port order, converting single-ended data to mixed-mode S-parameters, and checking passivity.
The analysis and simulation of S-parameters is required for the design of high-speed digital interconnects to identify issues and develop equalization algorithms in SerDes Toolbox™.

Figure 4. Communication channel modeled with S-parameters in Signal Integrity Toolbox. Channel losses and dispersion impact the eye diagram and reduce the margins of vertical and horizontal openings.
Using S-Parameters for RF Budget Analysis and System Design in MATLAB and Simulink
System design of RF transmitters and receivers begins with a budget analysis of gain, power, noise, and nonlinearity. In the early stages of the design, system engineers use S-parameter data to anticipate the frequency dependent behavior of selected components and to predict the impact of impedance mismatches.
As the wireless system design is elaborated, RF transceiver models and S-parameter data are simulated in RF Blockset™ together with baseband algorithms to estimate the system performance in terms of bit error rate (BER), adjacent channel leakage ratio (ACLR), or error vector magnitude (EVM).

RF budget analysis in RF Toolbox using data sheet specifications and S-parameter data.
Using S-Parameters for Matching Network Design in MATLAB
S-parameter data is used for matching network design to improve the RF system performance. Often the design of matching networks is combined with an optimization routine to determine the best possible trade-off between different requirements.
With RF Toolbox, you can design matching networks for antennas and minimize mismatch losses. Similarly, you can use S-parameter data to design input and output matching networks of low noise amplifiers (LNA) and improve the tradeoff between maximizing gain and minimizing the noise figure using Optimization Toolbox™.
Matching networks can be implemented using lumped components, such as RLC, or planar distributed elements, like microstrips, stubs, and tapers designed on PCBs.

Introduction to using S-parameter data in RF Toolbox.
How To
Examples
Videos
Software Reference
S-Parameter FAQs
S-parameters (scattering parameters or S-matrix) represent the linear characteristics of RF electronic circuits and components, describing the relationship between incident, reflected, and transmitted waves at each port over a range of frequencies.
S11 is input port reflection, S12 is reverse gain, S21 is forward gain (linear gain/insertion loss), and S22 is output port reflection.
Y- or Z-parameters require open- and short-circuit terminations that are challenging to maintain at RF and microwave frequencies, making their measurement less reliable than S-parameters.
S11 provides a direct measure of port matching: S11=1 represents an open circuit, S11=-1 represents a short circuit, and S11=0 represents a perfectly matched circuit.
S-parameters are often stored in the Touchstone file format, which most RF analysis tools and simulators can read and write, making it portable for exchanging measurements and design information.
S-parameter elements can be visualized on Cartesian plots showing magnitude and phase, on polar plots, or on Smith charts using RF Toolbox for matching network design and stability analysis.
No. MATLAB can handle any arbitrary number of ports.
S-parameters are used for RF budget analysis, matching network design, and signal integrity analysis in high-speed digital interconnects. They are used to describe frequency-dependent characteristics of amplifiers, filters, transmission lines, and other RF components.
Yes, S-parameters can be easily converted to Z-parameters, Y-parameters, and other linear matrices for circuit analysis or simulation.
See also: Antenna Toolbox, RF Toolbox, RF PCB Toolbox, RF Blockset, SerDes Toolbox, Signal Integrity Toolbox, wireless communications, RF system, 5G, beamforming, signal integrity