plot
Scatter plot or added variable plot of linear regression model
Description
plot( creates a plot of the linear
regression model mdl)mdl. The plot type depends on the number of
predictor variables.
If
mdlincludes multiple predictor variables,plotcreates an Added Variable Plot for the whole model except the constant (intercept) term, equivalent toplotAdded(mdl).If
mdlincludes a single predictor variable,plotcreates a scatter plot of the data along with a fitted curve and confidence bounds.If
mdldoes not include a predictor,plotcreates a histogram of the residuals, equivalent toplotResiduals(mdl).
h = plot(___)h to modify the
properties of a specific line or patch after you create the plot. For a list of
properties, see Line Properties and Patch Properties.
Examples
Create a linear regression model of car mileage as a function of weight and model year. Then create an added variable plot to see the significance of the model.
Create a linear regression model of mileage from the carsmall data set.
load carsmall
Year = categorical(Model_Year);
tbl = table(MPG,Weight,Year);
mdl = fitlm(tbl,'MPG ~ Year + Weight^2');
Create an added variable plot of the model.
plot(mdl)
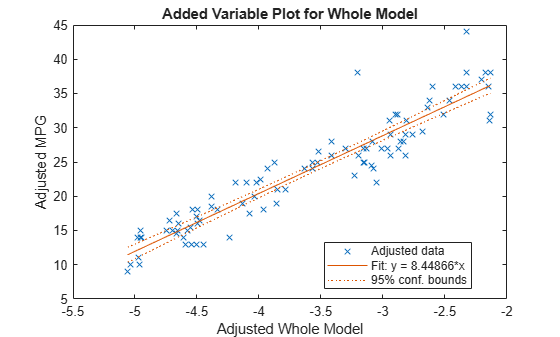
The plot illustrates that the model is significant because a horizontal line does not fit between the confidence bounds.
Create the same plot by using the plotAdded function.
plotAdded(mdl)

Create a scatter plot of data along with a fitted curve and confidence bounds for a simple linear regression model. A simple linear regression model includes only one predictor variable.
Create a simple linear regression model of mileage from the carsmall data set.
load carsmall
tbl = table(MPG,Weight);
mdl = fitlm(tbl,'MPG ~ Weight')
mdl =
Linear regression model:
    MPG ~ 1 + Weight

Estimated Coefficients:
                    Estimate        SE         tStat       pValue
                   __________    _________    _______    __________

    (Intercept)        49.238       1.6411     30.002    2.7015e-49
    Weight         -0.0086119    0.0005348    -16.103    1.6434e-28


Number of observations: 94, Error degrees of freedom: 92
Root Mean Squared Error: 4.13
R-squared: 0.738,  Adjusted R-Squared: 0.735
F-statistic vs. constant model: 259, p-value = 1.64e-28
pValue of the Weight variable is very small, which means that the variable is statistically significant in the model. Visualize this result by creating a scatter plot of the data, along with a fitted curve and its 95% confidence bounds, using the plot function.
plot(mdl)
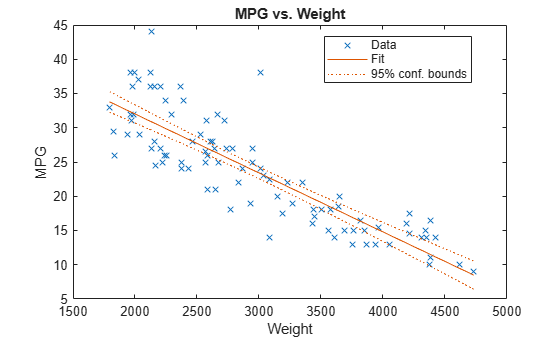
The plot illustrates that the model is significant because a horizontal line does not fit between the confidence bounds, which is consistent with the pValue result.
Create the same plot by using the plotAdded function.
plotAdded(mdl)
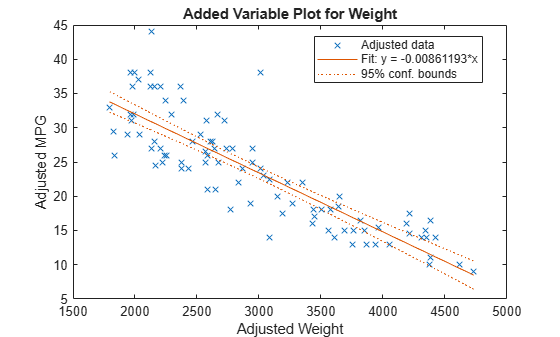
When a model includes only one term in addition to the constant term, an adjusted value is equivalent to its original value. Therefore, this added variable plot is the same as the scatter plot created by the plot function.
Input Arguments
Output Arguments
More About
Tips
The data cursor displays the values of the selected plot point in a data tip (small text box located next to the data point). The data tip includes the x-axis and y-axis values for the selected point, along with the observation name or number.
Alternative Functionality
A
LinearModelobject provides multiple plotting functions.When creating a model, use
plotAddedto understand the effect of adding or removing a predictor variable.When verifying a model, use
plotDiagnosticsto find questionable data and to understand the effect of each observation. Also, useplotResidualsto analyze the residuals of the model.After fitting a model, use
plotAdjustedResponse,plotPartialDependence, andplotEffectsto understand the effect of a particular predictor. UseplotInteractionto understand the interaction effect between two predictors. Also, useplotSliceto plot slices through the prediction surface.
The
plotfunction creates an added variable plot for the model as a whole (except a constant term) if the model includes multiple terms. UseplotAddedto select particular predictors for an added variable plot.
Extended Capabilities
Version History
Introduced in R2012a