Main Content

BayesianOptimization

Bayesian optimization results

Description

A BayesianOptimization object is the output of the bayesopt function and contains the results of a Bayesian optimization. In addition, the object contains data for each iteration of bayesopt that can be accessed by a plot function or an output function.

Creation

Create a BayesianOptimization object by using the bayesopt function. For more information, see Ways to Perform Bayesian Optimization.

Properties

expand all

Problem Definition Properties

This property is read-only.

ObjectiveFcn argument used by bayesopt, returned as a function handle. When you call bayesopt directly, ObjectiveFcn is the bayesopt objective function argument.

Data Types: function_handle

This property is read-only.

VariableDescriptions argument that bayesopt used, returned as a vector of optimizableVariable objects. When you call bayesopt directly, VariableDescriptions is the bayesopt variable description argument.

This property is read-only.

Options used by bayesopt, returned as a structure. When you call bayesopt directly, Options is the set of options used in bayesopt, which correspond to the name-value arguments. See Input Arguments of bayesopt.

Options contains the following fields.

Option NameMeaning
AcquisitionFunctionNameAcquisition function name (with dashes removed). See Acquisition Function Types.
IsObjectiveDeterministictrue means the objective function is deterministic, false otherwise.
ExplorationRatioUsed only when AcquisitionFunctionName is 'expectedimprovementplus' or 'expectedimprovement-persecondplus'. See Plus.
  
MaxObjectiveEvaluationsObjective function evaluation limit.
MaxTimeTime limit.
  
XConstraintFcnDeterministic constraints on variables. See Deterministic Constraints — XConstraintFcn.
ConditionalVariableFcnConditional variable constraints. See Conditional Constraints — ConditionalVariableFcn.
NumCoupledConstraintsNumber of coupled constraints. See Coupled Constraints.
CoupledConstraintTolerancesCoupled constraint tolerances. See Coupled Constraints.
AreCoupledConstraintsDeterministicLogical vector specifying whether each coupled constraint is deterministic.
  
VerboseCommand-line display level.
OutputFcnFunction called after each iteration. See Bayesian Optimization Output Functions.
SaveVariableNameVariable name for the @assignInBase output function.
SaveFileNameFile name for the @saveToFile output function.
PlotFcnPlot function called after each iteration. See Bayesian Optimization Plot Functions
  
InitialXPoints where bayesopt evaluated the objective function.
InitialObjectiveObjective function values at InitialX.
InitialConstraintViolationsCoupled constraint function values at InitialX.
InitialErrorValuesError values at InitialX.
InitialObjectiveEvaluationTimesObjective function evaluation times at InitialX.
InitialIterationTimesTime for each iteration, including objective function evaluation and other computations.

Data Types: struct

Solution Properties

This property is read-only.

Minimum observed value of the objective function, returned as a real scalar. When the optimization includes coupled constraints or evaluation errors, this value is the minimum over all observed points that are feasible according to the final constraint and error models.

Data Types: double

This property is read-only.

Observed point with the minimum objective function value, returned as a 1-by-D table, where D is the number of variables.

Data Types: table

This property is read-only.

Estimated objective function value at XAtMinEstimatedObjective, returned as a real scalar.

MinEstimatedObjective is the mean value of the posterior distribution of the final objective model. The software estimates the MinEstimatedObjective value by passing XAtMinEstimatedObjective to the object function predictObjective.

Data Types: double

This property is read-only.

Point with the minimum upper confidence bound of the objective function value among the visited points, returned as a 1-by-D table, where D is the number of variables. The software uses the final objective model to find the upper confidence bounds of the visited points.

XAtMinEstimatedObjective is the same as the best point returned by the bestPoint function with the default criterion ('min-visited-upper-confidence-interval').

Data Types: table

This property is read-only.

Number of objective function evaluations, returned as a positive integer. This number includes the initial evaluations used to form a posterior model, as well as evaluations during the optimization iterations.

Data Types: double

This property is read-only.

Total elapsed time of the optimization in seconds, returned as a positive scalar.

Data Types: double

This property is read-only.

Next point to evaluate if the optimization continues, returned as a 1-by-D table, where D is the number of variables.

Data Types: table

Trace Properties

This property is read-only.

Points at which the objective function is evaluated, returned as a T-by-D table, where T is the number of evaluation points and D is the number of variables.

Data Types: table

This property is read-only.

Objective function values, returned as a column vector of length T, where T is the number of evaluation points. ObjectiveTrace contains the history of the objective function evaluations.

Data Types: double

This property is read-only.

Objective function evaluation times, returned as a column vector of length T, where T is the number of evaluation points. ObjectiveEvaluationTimeTrace includes the time required to evaluate coupled constraints, because the objective function computes these constraints.

Data Types: double

This property is read-only.

Iteration times, returned as a column vector of length T, where T is the number of evaluation points. IterationTimeTrace includes the objective function evaluation time and other overhead.

Data Types: double

This property is read-only.

Coupled constraint values, returned as a T-by-K array, where T is the number of evaluation points and K is the number of coupled constraints.

Data Types: double

This property is read-only.

Error indications, returned as a column vector of length T containing -1 or 1 entries, where T is the number of evaluation points. Each 1 entry indicates that the objective function issues an error or returns NaN on the corresponding point in XTrace. Each -1 entry indicates that the software computes the objective function value.

Data Types: double

This property is read-only.

Feasibility indications, returned as a logical column vector of length T, where T is the number of evaluation points. Each 1 entry indicates that the final constraint model predicts feasibility at the corresponding point in XTrace.

Data Types: logical

This property is read-only.

Probability that an evaluation point is feasible, returned as a column vector of length T, where T is the number of evaluation points. The probabilities come from the final constraint model, including the error constraint model, on the corresponding points in XTrace.

Data Types: double

This property is read-only.

Evaluation that gives the minimum feasible objective, returned as a column vector of integer indices of length T, where T is the number of evaluation points. Feasibility is determined with respect to the constraint models at each iteration, including the error constraint model.

Data Types: double

This property is read-only.

Minimum observed objective, returned as a column vector of length T, where T is the number of evaluation points.

Data Types: double

This property is read-only.

Estimated objective, returned as a column vector of length T, where T is the number of evaluation points. The estimated objective at each iteration is determined with respect to the objective model at that iteration. At each iteration, the software uses the object function predictObjective to estimate the objective function value at the point with the minimum upper confidence bound of the objective function among the visited points.

Data Types: double

This property is read-only.

Auxiliary data from the objective function, returned as a cell array of length T, where T is the number of evaluation points. Each entry in the cell array is the UserData value returned in the third output of the objective function.

Data Types: cell

Object Functions

bestPointBest point in a Bayesian optimization according to a criterion
plotPlot Bayesian optimization results
predictConstraintsPredict coupled constraint violations at a set of points
predictErrorPredict error value at a set of points
predictObjectivePredict objective function at a set of points
predictObjectiveEvaluationTimePredict objective function run times at a set of points
resumeResume a Bayesian optimization

Examples

collapse all

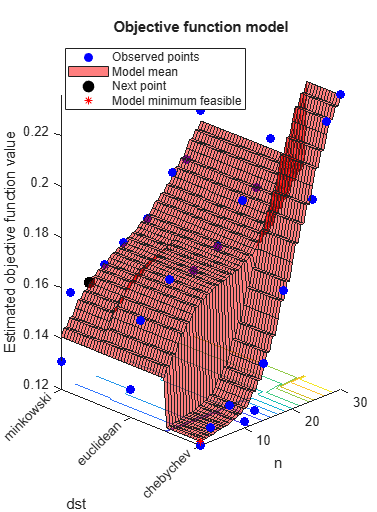
This example shows how to create a BayesianOptimization object by using bayesopt to minimize cross-validation loss.

Optimize hyperparameters of a KNN classifier for the ionosphere data, that is, find KNN hyperparameters that minimize the cross-validation loss. Have bayesopt minimize over the following hyperparameters:

  • Nearest-neighborhood sizes from 1 to 30

  • Distance functions 'chebychev', 'euclidean', and 'minkowski'.

For reproducibility, set the random seed, set the partition, and set the AcquisitionFunctionName option to 'expected-improvement-plus'. To suppress iterative display, set 'Verbose' to 0. Pass the partition c and fitting data X and Y to the objective function fun by creating fun as an anonymous function that incorporates this data. See Parameterizing Functions.

load ionosphere
rng default
num = optimizableVariable('n',[1,30],'Type','integer');
dst = optimizableVariable('dst',{'chebychev','euclidean','minkowski'},'Type','categorical');
c = cvpartition(351,'Kfold',5);
fun = @(x)kfoldLoss(fitcknn(X,Y,'CVPartition',c,'NumNeighbors',x.n,...
    'Distance',char(x.dst),'NSMethod','exhaustive'));
results = bayesopt(fun,[num,dst],'Verbose',0,...
    'AcquisitionFunctionName','expected-improvement-plus')

Figure contains an axes object. The axes object with title Objective function model, xlabel n, ylabel dst contains 5 objects of type line, surface, contour. One or more of the lines displays its values using only markers These objects represent Observed points, Model mean, Next point, Model minimum feasible.

Figure contains an axes object. The axes object with title Min objective vs. Number of function evaluations, xlabel Function evaluations, ylabel Min objective contains 2 objects of type line. These objects represent Min observed objective, Estimated min objective.

results = 
  BayesianOptimization with properties:

                      ObjectiveFcn: @(x)kfoldLoss(fitcknn(X,Y,'CVPartition',c,'NumNeighbors',x.n,'Distance',char(x.dst),'NSMethod','exhaustive'))
              VariableDescriptions: [1×2 optimizableVariable]
                           Options: [1×1 struct]
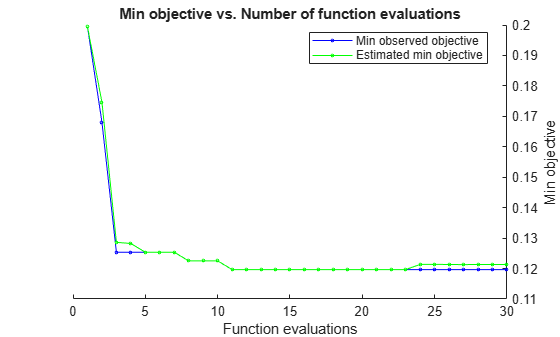
                      MinObjective: 0.1197
                   XAtMinObjective: [1×2 table]
             MinEstimatedObjective: 0.1213
          XAtMinEstimatedObjective: [1×2 table]
           NumObjectiveEvaluations: 30
                  TotalElapsedTime: 30.3867
                         NextPoint: [1×2 table]
                            XTrace: [30×2 table]
                    ObjectiveTrace: [30×1 double]
                  ConstraintsTrace: []
                     UserDataTrace: {30×1 cell}
      ObjectiveEvaluationTimeTrace: [30×1 double]
                IterationTimeTrace: [30×1 double]
                        ErrorTrace: [30×1 double]
                  FeasibilityTrace: [30×1 logical]
       FeasibilityProbabilityTrace: [30×1 double]
               IndexOfMinimumTrace: [30×1 double]
             ObjectiveMinimumTrace: [30×1 double]
    EstimatedObjectiveMinimumTrace: [30×1 double]

Version History

Introduced in R2016b