Modulation and Demodulation Using Complex Envelope
This example simulates the different steps of a basic communication process. Communication systems work by modulating chunks of information into a higher carrier frequency, transmitting the modulated signals through a noisy physical channel, receiving the noisy waveforms, and demodulating the received signals to reconstruct the initial information.
All the information carried in a real-valued signal can be represented by a corresponding lowpass complex envelope:
.
In this equation:
is the carrier frequency*.*
represents the real part of a complex-valued quantity.
is the complex envelope of .
is the in-phase component of the complex envelope.
is the quadrature component of the complex envelope.
The complex envelope is modulated to the carrier frequency and sent through the channel. At the receiver, the noisy waveform is demodulated using the carrier frequency. The phase variation due to the carrier frequency is predictable and thus does not convey any information. The complex envelope does not include the phase variation and can be sampled at a lower rate.
Generate a signal whose complex envelope consists of a sinusoid and a chirp. The in-phase component is a sinusoid with a frequency of 19 Hz. The quadrature component is a quadratic chirp whose frequency ranges from 61 Hz to 603 Hz. The signal is sampled at 2 kHz for 1 second.
fs = 2e3;
t = (0:1/fs:1-1/fs)';
inph = sin(2*pi*19*t);
quad = chirp(t-0.6,61,t(end),603,"quadratic");
Compute the complex envelope and store it as a MATLAB® timetable of sample rate fs.
env = inph + 1j*quad;
g = timetable(env,SampleRate=fs);
Open Signal Analyzer and drag the complex envelope from the Workspace Browser to the Signal table. The display shows the in-phase and quadrature components of the envelope as lines of the same hue and saturation, but different luminosity. The first line color represents the in-phase component and the second line color represents the quadrature component.
On the Display tab, select Spectrum from the Spectrum list. The app displays a set of axes with the signal spectrum. Click Panner to activate the panner and create a zoom window between 300 ms and 700 ms. The complex envelope has a two-sided spectrum, displayed as a line of the same color of the in-phase component of the complex envelope. The spectrum has an impulse at 0.19 kHz and a wider tapering profile at higher frequencies. The negative-frequency region of the spectrum is a mirror image of the positive-frequency region.

Modulate the signal using a carrier frequency of 200 Hz. Multiply by so that the power of the modulated signal equals the power of the original signal. Add white Gaussian noise such that the signal-to-noise ratio is 40 dB.
fc = 200;
mod = sqrt(2)*real(env.*exp(2j*pi*fc*t));

SNR = 40;
mod = mod + randn(size(mod))*std(mod)/db2mag(SNR);
s = timetable(mod,SampleRate=fs);
Click Display Grid to add a second display. Drag the modulated signal to the Signal table and add this signal and its spectrum to the second display. The modulation has moved the spectrum to positive frequencies centered on the carrier frequency.

Calculate the analytic signal. Demodulate the signal by multiplying the analytic signal with a complex-valued negative exponential of frequency 200 Hz.

dem = hilbert(mod).*exp(-2j*pi*fc*t)/sqrt(2);
Remove the second display and click Clear Display. Drag the demodulated signal to the display. Add time information to the complex envelope by clicking Time Values on the Analyzer tab. Select Time Values from the Time Specification list and then input the variable t for Time Values. The two-sided spectrum shows the recovered in-phase and quadrature components of the baseband signal.

On the Display tab, click Data Cursors and select Two. Place the time-domain cursors at 300 ms and 900 ms, so they enclose the spectral peaks. Check the Preserve Start Time box. Click the arrow next to Extract Signals and select Between Time Cursors. Clear the display and plot the extracted signal. The app extracts both in-phase and quadrature components of the demodulated signal in the region of interest. Select the extracted signal by clicking its Name column in the Signal table. On the Analyzer tab, click Export and save the signal to a MAT file called dem_ROI.mat.

Load the dem_ROI file to the Workspace. Compute the demodulated in-phase and quadrature components by taking the real and imaginary parts of the extracted signal. Store the time information of the extracted signal in a time variable t_dem.
load dem_ROI
inph_dem = real(dem_ROI);
quad_dem = imag(dem_ROI);
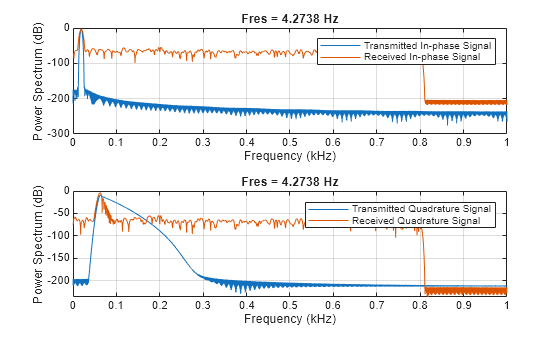
t_dem = 0.3+(0:length(dem_ROI)-1)/fs;Compare the transmitted waveforms and the extracted regions of interest. Also compare their spectra.
tiledlayout("flow")
nexttile
plot(t,inph,t_dem,inph_dem,'--')
legend("Transmitted In-phase Signal","Received In-phase Signal")

nexttile
plot(t,quad,t_dem,quad_dem,'--')
legend("Transmitted Quadrature Signal","Received Quadrature Signal")

figure
tiledlayout("flow")
nexttile
pspectrum(inph,fs)
hold on
pspectrum(inph_dem,fs)
legend("Transmitted In-phase Signal","Received In-phase Signal")
hold off

nexttile
pspectrum(quad,fs)
hold on
pspectrum(quad_dem,fs)
legend("Transmitted Quadrature Signal","Received Quadrature Signal")
hold off
See Also
Apps
Functions
Topics
- Find Delay Between Correlated Signals
- Resolve Tones by Varying Window Leakage
- Compute Signal Spectrum Using Different Windows
- Find Interference Using Persistence Spectrum
- Find and Track Ridges Using Reassigned Spectrogram
- Extract Voices from Music Signal
- Resample and Filter a Nonuniformly Sampled Signal
- Declip Saturated Signals Using Your Own Function
- Compute Envelope Spectrum of Vibration Signal
- Extract Regions of Interest from Whale Song
- Use Signal Analyzer App
- Edit Sample Rate and Other Time Information
- Data Types Supported by Signal Analyzer
- Spectrum Computation in Signal Analyzer
- Persistence Spectrum in Signal Analyzer
- Spectrogram Computation in Signal Analyzer
- Scalogram Computation in Signal Analyzer
- Keyboard Shortcuts for Signal Analyzer
- Signal Analyzer Tips and Limitations