surfnorm
Surface normals
Description
surfnorm(
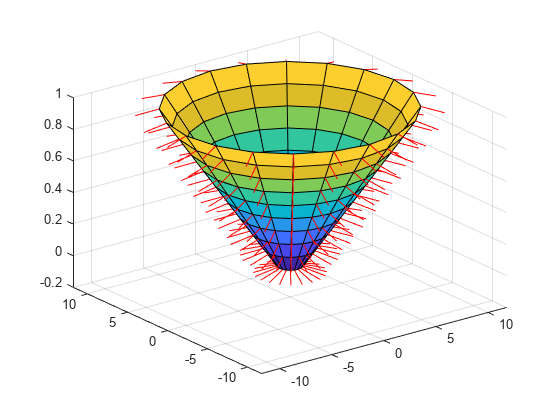
creates a three-dimensional surface plot and displays its surface normals. A
surface normal is the imaginary line perpendicular to a flat surface, or
perpendicular to the tangent plane at a point on a non-flat surface.X,Y,Z)
The function plots the values in matrix Z as heights above
a grid in the x-y plane defined by
X and Y. The color of the surface
varies according to the heights specified by Z. The matrices
X, Y, and Z must be
the same size.
surfnorm( creates a surface with
normals and uses the column and row indices of the elements in
Z)Z as the x and
y-coordinates, respectively.
surfnorm( plots
into the axes specified by ax,___)ax instead of the current axes.
Specify the axes as the first input argument.
surfnorm(___,
specifies surface properties using one or more name-value pair arguments. For
example, Name,Value)'FaceAlpha',0.5 creates a semitransparent
surface.
Examples
Input Arguments
Name-Value Arguments
Output Arguments
Tips
To reverse the direction of the normals, call
surfnormwith transposed arguments:surfnorm(X',Y',Z')
To show the direction of the normals on a surface, use the
surfnormfunction to calculate the surface normals and then thequiver3function to display them.[Nx,Ny,Nz] = surfnorm(X,Y,Z); quiver3(X,Y,Z,Nx,Ny,Nz)
The surface normals represent conditions at vertices and are not normalized. Normals for surface elements that face away from the viewer are not visible.
Algorithms
surfnorm uses bicubic interpolation in the x,
y, and z directions to calculate the surface
normals of the data. To allow for interpolation at the boundaries, the function uses
quadratic extrapolation to expand the data. After performing the bicubic fit of the
data, diagonal vectors are computed and crossed to form the normal at each
vertex.
Version History
Introduced before R2006a
