WMSMapRequest
Web Map Service map request
Description
A WMSMapRequest object contains a request to a WMS server
to obtain a map, which represents geographic information. The WMS server renders the map
as a color or grayscale image. The object contains properties that you can set to
control the geographic extent, rendering, or size of the requested map.
Creation
Description
mapRequest = WMSMapRequest(layer) creates a
WMSMapRequest object, setting the
Layer property. The WMSMapRequest
object updates the properties of Layer, if
necessary.
mapRequest = WMSMapRequest(layer,server) creates a
WMSMapRequest object, setting the
Layer and Server properties. The
ServerURL property of layer must match
the ServerURL property of server. The
Server object updates Layer
properties.
Properties
Web map server, specified as a scalar WebMapServer object. If a server
is not supplied as an argument when creating the
WMSMapRequest, the value of
Server is set to the ServerURL
of Layer.
Web Map Service layers, specified as an array of WMSLayer objects.
Layer contains one unique
ServerURL, which must match the
ServerURL property of Server.
The Server property updates the properties of
Layer when the property is set.
Coordinate reference system code, specified as the character vector
'CRS:84' for WMS version 1.3.x, and
'EPSG:4326' for all other versions.
If
'EPSG:4326'is not found inLayer.CoordRefSysCodes, then theCoordRefSysCodevalue is set from the firstCoordRefSysCodefound in theLayer.Details.BoundingBoxstructure array.When
CoordRefSysCodeis set to'EPSG:4326'or'CRS:84', theXLimandYLimproperties are set to[]and theLatlimandLonlimproperties are set to the geographic extent defined by theLayerarray.When
CoordRefSysCodeis set to a value other than'EPSG:4326'or'CRS:84', then theXLimandYLimproperties are set from the values found in theLayer.Details.BoundingBoxstructure and theLatlimandLonlimproperties are set to[].Automatic projections are not supported. (Automatic projections begin with
'AUTO'.)
Data Types: char
Map or geographic raster reference, specified as a MapCellsReference or GeographicCellsReference object.
RasterReference references the raster map to an
intrinsic coordinate system
Latitude limits, specified as a two-element vector.
Latlim contains the southern and northern
latitudinal limits of the request in units of degrees. The limits must be
ascending. By default, the latitude limits span all latitudinal limits found
in the Layer.Latlim property.
Longitude limits, specified as a two-element vector.
Lonlim contains the western and eastern
longitudinal limits of the request in units of degrees. The limits must be
ascending and in the range [-180, 180] or [0, 360]. By default, the
longitude limits span all longitudinal limits found in the
Layer.Lonlim property.
Western and eastern limits of the requested map in the units of the
coordinate reference system, specified as a two-element vector. The limits
must be ascending. You can set XLim only if you set
CoordRefSysCode to a value other than
EPSG:4326.
Southern and northern limits of the requested map in the units of the
coordinate reference system, specified as a two-element vector. The limits
must be ascending. You can set YLim only if you set
CoordRefSysCode to a value other than
EPSG:4326.
Height in pixels for the requested raster map, specified as a positive
integer. The property MaximumHeight defines the maximum
value for ImageHeight. The
WMSMapRequest object initializes the
ImageHeight property to either 512 or to an integer
value that best preserves the aspect ratio of the coordinate limits, without
changing the coordinate limits.
Width in pixels for the requested raster map, specified as a positive
integer. The property MaximumWidth defines the maximum
value for ImageWidth. The
WMSMapRequest object initializes the
ImageWidth property to either 512 or to an integer
value that best preserves the aspect ratio of the coordinate limits, without
changing the coordinate limits.
This property is read-only.
Maximum height in pixels for the requested map, specified as the number 8192.
Data Types: double
This property is read-only.
Maximum width in pixels for the requested map, specified as the number 8192.
Data Types: double
Elevation extent of the requested map, specified as a character vector.
When you set the property, 'elevation' must be the value
of the Layer.Details.Dimension.Name field.
Time extent of the requested map, specified as a numeric scalar, a string scalar, or a character vector. This property stores time using the ISO® 8601:1988(E) extended format.
When you specify a numeric scalar, the
Timeproperty interprets the input as a serial date number, which represents the whole and fractional number of days from January 0, 0000. For example, to set the time extent of a WMS map request object,mapRequest, as731885.75days after January 0, 0000, usemapRequest.Time = 731885.75. MATLAB® stores numeric scalar input inTimeusing a character vector in'yyyy-mm-dd'format.When you specify a string scalar or character vector, the
Timeproperty interprets the input as a date and time. For example, to set the time extent of a WMS map request object,mapRequest, to March 17, 2022, you can usemapRequest.Time = "03/17/22". Express hours, minutes, and seconds in Coordinated Universal Time (UTC).This table shows the string scalar and character vector inputs you can use to set the
Timeproperty and how theTimeproperty stores the inputs.Input Format Input Format Example Stored Format Stored Format Example "mm-dd-yyyy HH:MM:SS""17-03-2022 14:45:02"'yyyy-mm-ddTHH:MM:SSZ''2022-03-17T14:45:02Z'"mm-dd-yyyy""17-03-2022"'yyyy-mm-dd''2022-03-17'"mm/dd/yy""03/17/22"'yyyy-mm-dd''2022-03-17'"mm/dd""03/17"'yyyy-mm-dd'yyyyis the current year'2022-03-17'"yyyy""2022"'yyyy''2022'"HH:MM:SS""14:45:02"'yyyy-mm-ddTHH:MM:SSZ'yyyy,mm, andddare the current year, month, and day, respectively'2022-02-07T14:45:02Z'"HH:MM:SS PM""02:45:02 PM"'yyyy-mm-ddTHH:MM:SSZ'yyyy,mm, andddare the current year, month, and day, respectively'2022-02-07T14:45:02Z'"HH:MM""02:45"'yyyy-mm-ddTHH:MM:00Z'yyyy,mm, andddare the current year, month, and day, respectively'2022-02-07T02:45:00Z'"HH:MM PM""02:45 PM"'yyyy-mm-ddTHH:MM:00Z'yyyy,mm, andddare the current year, month, and day, respectively'2022-02-07T14:45:00Z'"mmm.dd,yyyy HH:MM:SS""Mar.07,2022 02:45:02"'mmm.dd,yyyy HH:MM:SS''Mar.07,2022 02:45:02'"mmm.dd,yyyy""Mar.07,2022"'mmm.dd,yyyy''Mar.07,2022'"mm/dd/yyyy ""03/17/2022"'yyyy-mm-dd''2022-03-17'"yyyy/mm/dd""2022/03/17"'yyyy-mm-dd''2022-03-17'"yyyy-mm-dd""2022-03-17"'yyyy-mm-dd''2022-03-17'"yyyymmddTHHMMSS""20220317T144502"'yyyy-mm-ddTHH:MM:SSZ''2022-03-17T14:45:02Z'"yyyy-mm-dd HH:MM:SS""2022-03-17 14:45:02"'yyyy-mm-ddTHH:MM:SSZ''2022-03-17T14:45:02Z'"current"indicates the most current data available on the server. Not all servers support this input."current"'current''current'"Byyyy"indicates a year BCE"B1000"indicates 1000 BCE'Byyyy''B1000'"Kx"indicatesxthousand years in the distant past"K10"indicates 10,000 years in the past'Kx''K10'"Mx"indicatesxmillion years in the distant past"M9"indicates 9 million years in the past'Mx''M9'"Gx"indicatesxbillion years in the distant past"G3"indicates 3 billion years in the past'Gx''G3'
To use this property, the dimension name of the layer must be
'time'. You can query the dimension name of a layer
by accessing the structure array in its Details property,
specifying the Dimension field, and, within the
Dimension structure array, specifying the
Name field. For example, given a layer
layer, specify
layer.Details.Dimension.Name.
Data Types: double | char | string
Name and value of a sample dimension, specified as a two-element cell
array of character vectors. The name cannot be 'time' or
'elevation'. SampleDimension{1}
must be the value of the Layer.Details.Dimension.Name
field.
Flag indicating transparency of map background, specified as a logical
scalar. When you set Transparent to
true, the server sets all pixels not representing
features or data values in that layer to a transparent value, producing a
composite map. When you set Transparent to
false, the server sets all non-data pixels to the
value of the background color.
Data Types: logical
Color of the background (non-data) pixels of the map, specified as a
three-element numeric vector. The values range from 0 to 255. The default
value, [255,255,255], specifies the background color as
white. You can set BackgroundColor using
non-uint8 numeric values, but they are cast and
stored as uint8.
Data Types: uint8
Style to use when rendering the image, specified as a character vector or
cell array of character vectors. The StyleName must be a
valid entry in the Layer.Details.Style.Name field. The
cell array of character vectors contains the same number of elements as does
Layer.
Desired image format used to render the map as an image, specified as a
character vector. If set, the format must match an entry in the
Layer.Details.ImageFormats cell array and an entry in
the ImageRenderFormats property. If not set, the format
defaults to a value in the ImageRenderFormats
property.
This property is read-only.
Preferred image rendering formats when Transparent is
set to false, specified as a cell array. The first entry
is the most preferred image format. If the preferred format is not stored in
the Layer property, then the next format from the list is
selected, until a format is found. The ImageRenderFormats
array is not used if the ImageFormat property is
set.
This property is read-only.
Preferred image rendering formats when Transparent is
set to true, specified as a cell array. The first entry
is the most preferred image format. If the preferred format is not stored in
the Layer property, then the next format from the list is
selected, until a format is found. If a transparent image format is not
found in the list, or if the ImageFormat property is set
to a non-default value, then ImageFormat is
unchanged.
Server URL for the WMS GetMap request, specified as a
character vector. In general, ServerURL matches the
ServerURL of the Layer. However,
some WMS servers, such as the Microsoft® TerraServer, require a different URL for
GetMap requests than for WMS
GetCapabilities requests. By default,
ServerURL is
Layer(1).ServerURL.
Data Types: char
This property is read-only.
Full URL for the WMS GetMap request, specified as a
character vector. It is composed of the ServerURL with
additional WMS parameter/value pairs.
Object Functions
boundImageSize | Bound size of raster map |
Examples
Create a web map server object that communicates with the WMS server provided by MathWorks®. Get the terrain elevation layer from the capabilities document.
serverURL = "https://wms.mathworks.com"; server = WebMapServer(serverURL); info = getCapabilities(server); elevation = refine(info.Layer,"elevation");
Create a map request object for the layer.
Get latitude and longitude limits for an area surrounding the Gulf of Maine.
Specify the sampling interval as
30arc-seconds.Calculate the image height and width by using the latitude limits, the longitude limits, and the sampling interval.
Request quantitative elevation data (rather than an image) by specifying the image format as BIL.
mapRequest = WMSMapRequest(elevation); GT = geocode("Gulf of Maine","physical",FilterResults="first"); [latlim,lonlim] = bounds(GT.Shape); mapRequest.Latlim = latlim; mapRequest.Lonlim = lonlim; samplingInterval = dms2degrees([0 0 30]); mapRequest.ImageHeight = round(abs(diff(mapRequest.Latlim))/samplingInterval); mapRequest.ImageWidth = round(abs(diff(mapRequest.Lonlim))/samplingInterval); mapRequest.ImageFormat = "image/bil";
Read the terrain data from the server into the workspace as an array and a geographic raster reference object. Prepare the data for plotting by converting the data type to double. To make the water areas appear blue on the plot, set elevations at sea level (Z == 0) to a value below sea level.
Z = getMap(server,mapRequest.RequestURL); R = mapRequest.RasterReference; Z = double(Z); Z(Z == 0) = -1;
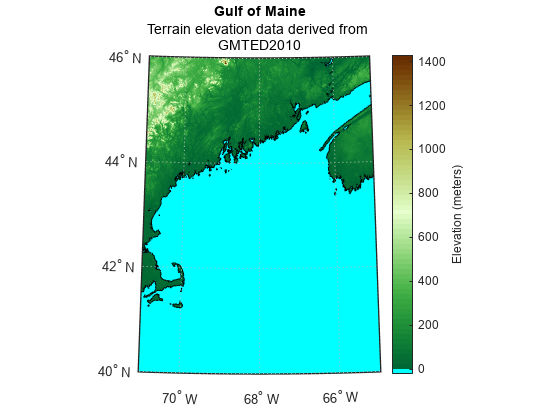
Display the elevation data on a map and plot contour lines at sea level.
figure worldmap(Z,R) geoshow(Z,R,DisplayType="texturemap") contourm(Z,R,[0,0],Color="k")
Customize the map by adding a title and subtitle, a colormap appropriate for elevation data, and a labeled color bar.
title("Gulf of Maine") st = textwrap(string(mapRequest.Layer.LayerTitle),40); subtitle(st) demcmap(Z) c = colorbar; c.Label.String = "Elevation (meters)";

Version History
Introduced in R2009b
See Also
Functions
Objects
MATLAB Command
You clicked a link that corresponds to this MATLAB command:
Run the command by entering it in the MATLAB Command Window. Web browsers do not support MATLAB commands.
Select a Web Site
Choose a web site to get translated content where available and see local events and offers. Based on your location, we recommend that you select: .
You can also select a web site from the following list
How to Get Best Site Performance
Select the China site (in Chinese or English) for best site performance. Other MathWorks country sites are not optimized for visits from your location.
Americas
- América Latina (Español)
- Canada (English)
- United States (English)
Europe
- Belgium (English)
- Denmark (English)
- Deutschland (Deutsch)
- España (Español)
- Finland (English)
- France (Français)
- Ireland (English)
- Italia (Italiano)
- Luxembourg (English)
- Netherlands (English)
- Norway (English)
- Österreich (Deutsch)
- Portugal (English)
- Sweden (English)
- Switzerland
- United Kingdom (English)