imageshow
Description
Note
The imageshow function displays 2-D images and large or blocked
images in a Viewer object. Use imageshow to
efficiently display large images, especially those that may be too large to fit in
memory. To display images in an axes, use imshow.
im = imageshow(I)Image object and displays the 2-D grayscale, RGB, or binary
image I.
im = imageshow(___,Name=Value)DisplayRangeMode="data-range" scales the DisplayRange
using the range of pixel values in the input image.
Examples
Display a grayscale, RGB, and binary image using the imageshow function.
Display Grayscale Image
Read a sample grayscale image into the workspace and display it.
I = imread("pout.tif");
im = imageshow(I);
Display RGB Image
Read a sample RGB image into the workspace and display it.
RGB = imread("baby.jpg");
imRGB = imageshow(RGB);
Display Binary Image
Create a binary image by thresholding the grayscale image, and display it.
BW = imbinarize(I);
imBW = imageshow(BW);
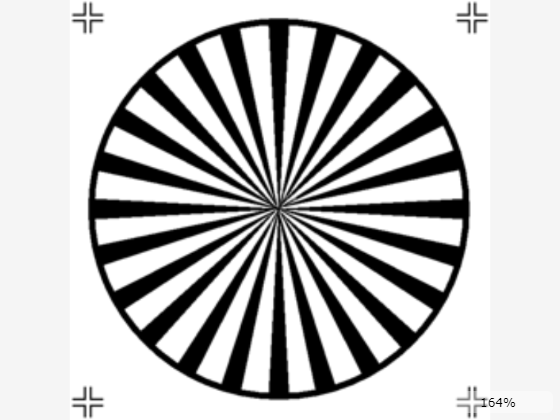
The display range defines which pixel intensity values map to the range of colors in the colormap. The display range defines the brightness and contrast, with a smaller display range resulting in higher contrast.
Specify Display Range as Image Data Range
Display a grayscale image. By default, the display range is equal to the full range of the data type of the image. For example, this image is data type uint8, so the display range is [0 255].
imageshow("pout.tif");
You can increase the contrast by specifying DisplayRangeMode as "data-range", which changes the DisplayRange value to the range of pixel values in the image.
imageshow("pout.tif",DisplayRangeMode="data-range");

Specify Display Range for 10-Bit and 12-Bit Images
Medical images often have values in the 10-bit or 12-bit range, but stored as data type int16. As a result, the pixel values occupy a small portion of the default display range, and the image displays with poor contrast. The viewer displays a yellow warning icon.
I = imageshow("CT-MONO2-16-ankle.dcm");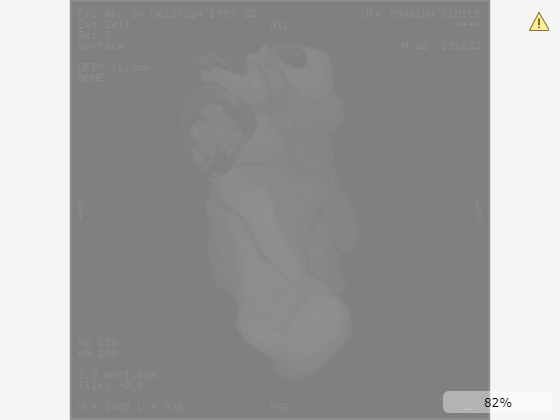
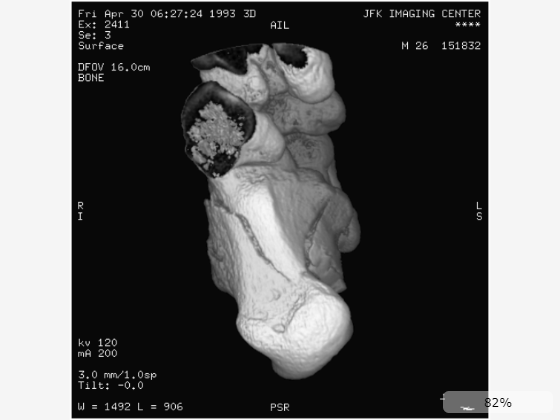
To improve the contrast, change the DisplayRangeMode. If you know the image has been acquired as a 10-bit or 12-bit image, specify the display range mode as "10-bit" or "12-bit", respectively. These options enable a more direct comparison across other 10-bit or 12-bit images versus specifying the display range as the data range of the individual image.
imageshow("CT-MONO2-16-ankle.dcm",DisplayRangeMode="12-bit");
Specify Display Range for RGB Images
For RGB images, you can adjust the display range uniformly across all channels, or specify per-channel display ranges to focus on a certain color. Display an RGB image of fabric.
imageshow("fabric.png");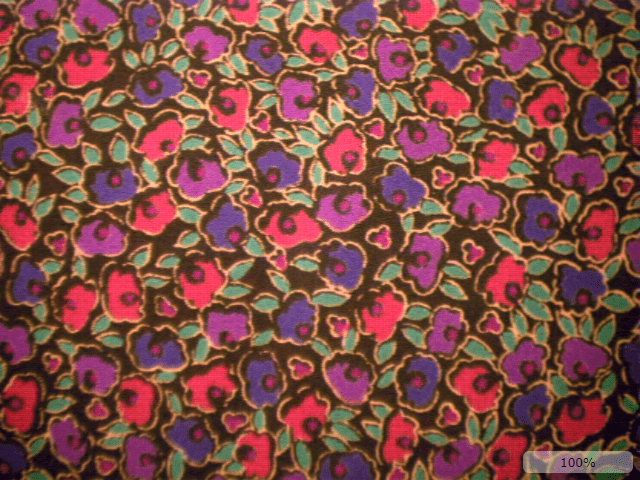
To change the display range uniformly for all channels, specify DisplayRange as a 2-element vector. Increasing the display range decreases the contrast of the color channels.
imageshow("fabric.png",DisplayRange=[0 1000]);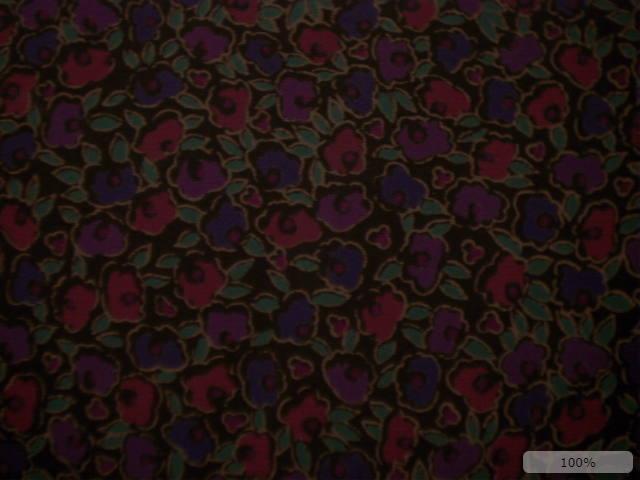
To change the display range for each channel, specify a 3-by-2 matrix where each row corresponds to the display range of the R, G, and B channels, respectively. Specify the display range to emphasize the green pixels.
imageshow("fabric.png",DisplayRange=[0 1000; 0 255; 0 1000]);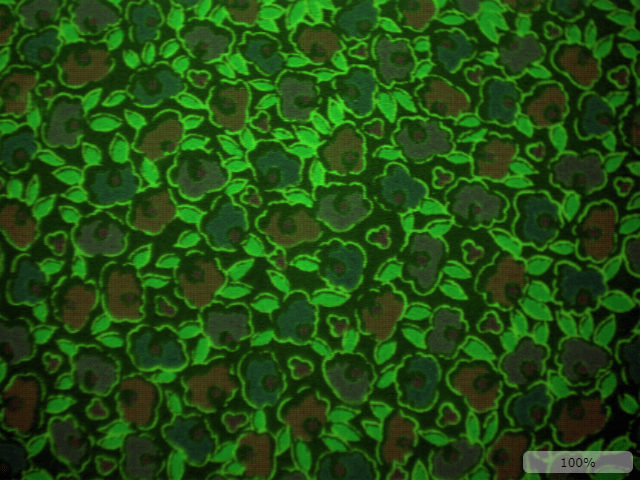
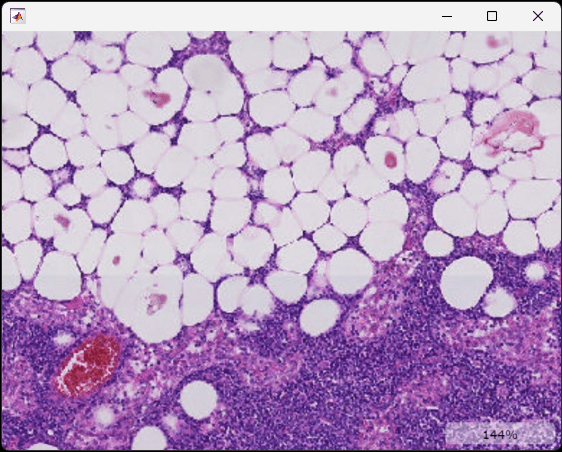
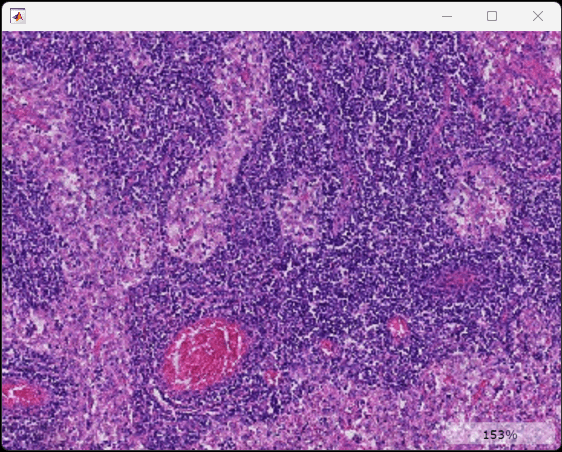
Display a modified version of a training image of a lymph node containing tumor tissue (tumor_091.tif) from the CAMELYON16 data set. The modified image has three coarse resolution levels, and has been adjusted to enforce a consistent aspect ratio and to register features at each level.
Create a blocked image from the sample image. The blockedImage object points to the large image in the file without loading the full image into memory.
bim = blockedImage("tumor_091R.tif");Display the blocked image using imageshow. The function displays the image at the best resolution size based on the size of the viewer and the available screen size.
imageshow(bim);

You can zoom in on the image using the mouse scroll wheel. As you zoom in, the resolution level automatically adjusts to a finer resolution based on the current field of view and screen size.
Pan the image by dragging inside the viewer.
Read a grayscale image of coins into the workspace.
I = imread("coins.png");Segment the coins from the background.
BW = imbinarize(I);
Identify each coin as a separate connected component.
CC = bwconncomp(BW);
Create a label matrix that labels background pixels 0 and assigns an integer value to each label region.
L = labelmatrix(CC);
Display the original grayscale image with the labels as an overlay. By default, imageshow displays background labels as fully transparent, and displays all other label values with a constant 50% transparency.
imageshow(I,OverlayData=L);
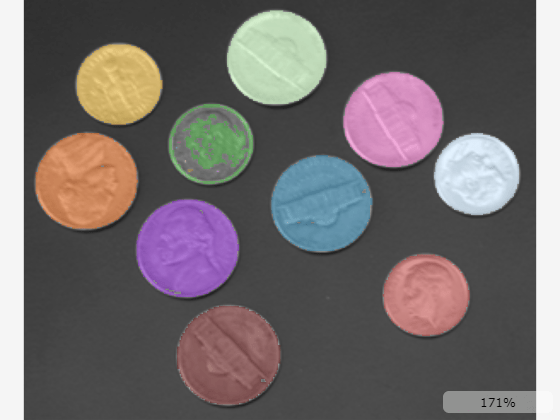
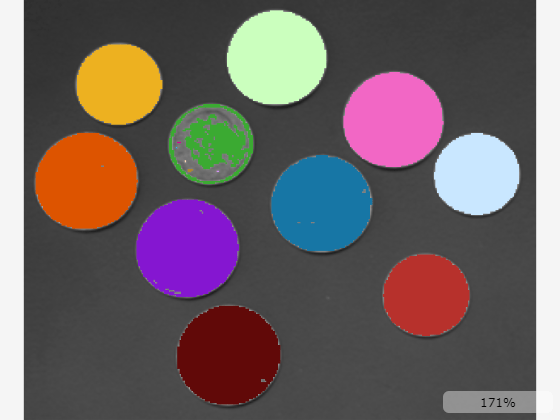
To change the transparency of the labels, specify the OverlayAlpha name-value argument. Display the labels as fully opaque.
imageshow(I,OverlayData=L,OverlayAlpha=1);
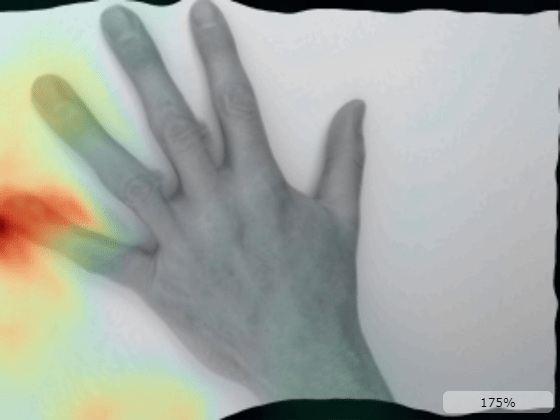
Use deformable image registration to estimate the displacement between two images of a hand, and display the displacement field as an overlay on the registered image.
Read two images of the same hand in different poses.
fixed  = imread("hands1.jpg");
moving = imread("hands2.jpg");
Convert the images from RGB to grayscale, and then perform histogram matching to correct for intensity differences between the images.
fixed  = im2gray(fixed);
moving = im2gray(moving);
moving = imhistmatch(moving,fixed);
Display the images side-by-side. The largest difference is in the position of the left-most finger.
imshowpair(fixed,moving,"montage")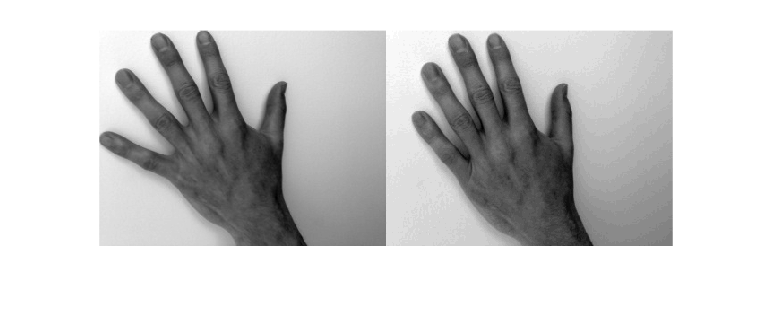
Calculate the displacement field needed to align the images.
[dispField,movingReg] = imregdemons(moving,fixed,[500 400 200], ...
    AccumulatedFieldSmoothing=1.3);
Calculate the magnitude of the displacement at each pixel.
dispMag = hypot(dispField(:,:,1),dispField(:,:,2));
Display the registered image with the displacement magnitude as a heatmap overlay. Specify these name-value arguments to set properties of the output Image object.
Specify the
OverlayDisplayRangeModeto limit the display range to the data range of the displacement field.Specify the
OverlayColormapas a continuous colormap such asturboorjet, which are suitable for displaying heatmap overlays. The default colormap is suitable for displaying discrete label regions.Specify the
OverlayAlphamapto specify a custom 50% transparency map that includes zero-valued overlay values. The default alphamap, defined byOverlaAlpha, displays zero-valued background pixels as fully transparent and is suitable for displaying discrete labels.
I = imageshow(movingReg,OverlayData=dispMag, ...
    OverlayDisplayRangeMode="data-range",OverlayColormap=turbo,OverlayAlphamap=0.5);
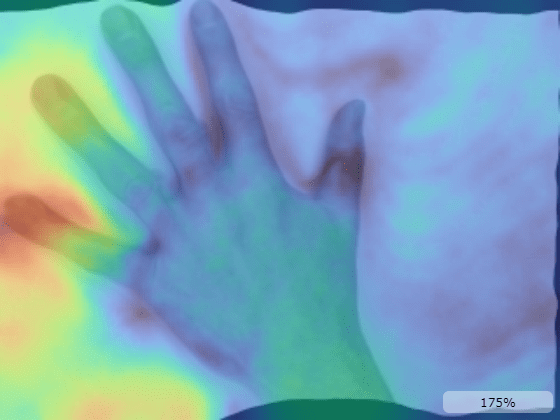
Alternatively, specify OverlayAlphamap as "linear" to apply an overlay alphamap that linearly maps increasing displacement values from fully transparent to fully opaque. The non-uniform alphamap emphasizes larger displacements by making them more opaque than smaller displacement values.
I = imageshow(movingReg,OverlayData=dispMag, ...
    OverlayDisplayRangeMode="data-range",OverlayColormap=turbo,OverlayAlphamap="linear");

Specify OverlayAlphamap as "quadratic" to apply a quadratic overlay alphamap, which emphasizes larger displacement values more than the linear map.
I = imageshow(movingReg,OverlayData=dispMag, ...
    OverlayDisplayRangeMode="data-range",OverlayColormap=turbo,OverlayAlphamap="quadratic");
Input Arguments
Image data, specified as one of the options in this table.
| Image Type | Description |
|---|---|
| Grayscale | Specify as an m-by-n numeric matrix. |
| Binary | Specify as an m-by-n matrix of data
type logical. |
| RGB | Specify as an m-by-n-by-3 numeric array. |
| Blocked image | Specify as a blockedImage object that reads 2-D blocks of grayscale, RGB, or
binary image data. |
Filename, specified as a string scalar or character vector. If the file contains
multiple images, then the function displays the first image in the file. The file must
be readable by the imread function, or be in the DICOM,
NITF, DPX, EXR, HDR, or RAW file format.
Data Types: char | string
Name-Value Arguments
Specify optional pairs of arguments as
Name1=Value1,...,NameN=ValueN, where Name is
the argument name and Value is the corresponding value.
Name-value arguments must appear after other arguments, but the order of the
pairs does not matter.
Example: imageshow(I,DisplayRangeMode="data-range") displays the image
I and sets the display range equal to the data range of
I.
Note
The properties listed here are only a subset. For a full list, see Image Properties.
Parent of the Image object, specified as a Viewer
object. You can create a Viewer object optimized for 2-D image
display by using the viewer2d
function. When you call imageshow without specifying a parent,
the function creates a new Viewer object and sets that object as the
parent. You cannot reparent an Image object.
Image interpolation method, specified as one of the values in this table.
| Value | Description |
|---|---|
"auto" | The interpolation method depends on the current zoom level. If one data pixel spans fewer than 10 screen pixels, the image displays using bilinear interpolation. If one data pixel spans more than 10 screen pixels, the image displays using nearest neighbor interpolation. |
"bilinear" | The image displays using bilinear interpolation. The value of a pixel located at (x, y) is the weighted average of the surrounding pixels in the original image. |
"nearest" | The image displays using nearest neighbor interpolation. The value of a pixel located at (x, y) is the value of the pixel closest to (x, y) in the original image. This option provides the fastest performance, and is recommended for workflows, such as the playback of multiframe image series, where rendering speed is more important than image quality. |
Colormap of the image content, specified as an n-by-3 numeric
matrix with values in the range [0, 1]. The maximum number of colors
n is 256. This value has no effect when viewing RGB images. You
can specify a different colormap for each Image object in a
scene.
Values less than or equal to the minimum value of DisplayRangeColormap, and all values greater than or equal to the maximum
value of DisplayRange map to the last color in
Colormap. Intermediate values map linearly to the intermediate
colors in the colormap.
Display range of the image content, specified as one of these options:
2-element row vector of the form
[min max]— Scale data according to the valuesminandmax. For RGB images, specifying a 2-element row vector applies the same data limits to all color channels.3-by-2 numeric matrix with rows of the form
[min max]— Scale each RGB channel according to the valuesminandmax. The first, second, and third rows specify the data limits for the red, green, and blue color channels, respectively.
When the DisplayRangeMode value is "data-range" or
"type-range", the DisplayRange updates
automatically to reflect the range of the data type or data of the current image,
respectively. If you specify DisplayRange, the
DisplayRangeMode value changes to
"manual".
Display range mode, specified as one of the options in this table.
| Value | Description |
|---|---|
"type-range" | Set the display range equal to the data type range. For example, for
uint8 images, the display range is [0
255]. |
"data-range" | Set the display range equal to the data range of the image. For RGB images, the data range is the overall minimum and maximum across channels. |
"10-bit" | Set the display range to [0 1023]. This value is
useful for displaying medical images with 10-bit data ranges. |
"12-bit" | Set the display range to [0 4095]. This value is
useful for displaying medical images with 12-bit data ranges. |
"manual" | Manually set a fixed display range using DisplayRange. Specifying DisplayRange
automatically sets DisplayRangeMode to
"manual". |
Transparency channel for the image data, specified as one of the options in this table.
| Value | Description |
|---|---|
| Numeric scalar | Display the image with a constant transparency for all pixels. |
| m-by-n numeric matrix | Specify the transparency value for each pixel directly. m and n are the lengths of the first and second dimensions of the input image, respectively. |
2-D blockedImage object | Specify the transparency for each pixel of the blocked image directly.
Use this option when you specify I as a
blockedImage object. The blocked images for
I and AlphaData must have the
same Size, BlockSize,
SizeInBlocks, NumLevels,
WorldStart, and WorldEnd
values. |
Overlay data to blend with the image data, specified as a numeric array,
categorical array, or a blockedImage object. If you specify
I as a blockedImage, specify
OverlayData as a single-resolution
blockedImage or as a multilevel blockedImage with
the same Size, BlockSize,
SizeInBlocks, NumLevels,
WorldStart, and WorldEnd values.
You can modify the appearance of the overlay by changing the OverlayDisplayRange, OverlayColormap, OverlayAlpha, and OverlayAlphamap properties.
Output Arguments
Image, returned as an Image object. For more information about
modifying the aspects of the image, see Image Properties.
More About
The 2-D image viewer provides these tools for exploring and modifying the image display.
| Tool | Description | Representative Image |
|---|---|---|
| View pixel information | The viewer displays information about the pixel beneath the pointer. The display includes a zoomed in view of the pixel neighborhood, pixel coordinates, grayscale intensity or RGB color values, and the overlay value, if one is specified. To interactively toggle the visibility of the display, open
the context menu by right-clicking inside the viewer, and select or clear
Display info. Alternatively, you can toggle the
visibility programmatically by setting the You can copy or export the pixel information from the viewer context menu. To save individual values to the clipboard, select Copy intensity, Copy color, or Copy location. To save the pixel information as a structure in the workspace, select Export info to workspace. In the Export to workspace dialog box, specify a name for the structure and select OK. |
|
| Copy or save screenshot | To save a screenshot of the displayed image without the toolbar or scale bar, right-click to open the viewer context menu, and select Copy screenshot to clipboard or Save screenshot to file. |
|
| Adjust the display range | From the viewer toolbar, select the adjust window level icon |
|
| Measure distances | From the viewer toolbar, click the draw annotations icon To reposition one endpoint, drag the endpoint, rather than the line or the label. To move the whole line, including both endpoints, hold Ctrl and drag one of the endpoints. Right-click the line to open a context
menu from which you can edit the text label, remove the line, or export the line
to the workspace as a |
|
| Label point coordinates | From the viewer toolbar, click the draw annotations icon Right-click the point to open a context menu from which you can
edit the text label, remove the point, or export the point to the workspace as a
|
|
Extended Capabilities
Usage notes and limitations:
This function accepts GPU arrays for the input image I and the
AlphaData and OverlayData name-value arguments.
All rendering is performed using hardware-accelerated graphics if a suitable GPU is
available. There is no additional performance benefit of specifying inputs as a
gpuArray.
For more information, see Image Processing on a GPU.
Version History
Introduced in R2024bControl whether the parent viewer displays information about the image pixel beneath the
pointer by using the new Pickable property. You can set the
Pickable property using a name-value argument when you call the
imageshow function, or you can update the property of the
Image object using dot notation.
imageshow is recommended over bigimageshow in most cases because
it provides faster performance and a simpler interface that supports displaying 2-D images
of all sizes. For advanced display tasks that combine or customize properties of MATLAB®
Graphics Objects, such as creating a
tiledlayout or adding ROI annotation objects like
images.roi.Polygon, continue using
bigimageshow.
This table shows common uses of bigimageshow, and how you can
update your code to use imageshow instead.
| Old Code | Recommended Replacement |
|---|---|
This example uses the bim = blockedImage("tumor_091R.tif");
h = bigimageshow(bim);
| Here is equivalent code, creating an bim = blockedImage("tumor_091R.tif");
im = imageshow(bim);
|
This example uses the Load the blocked image and create the binary mask. bim = blockedImage("tumor_091R.tif");
bmask = apply(bim,@(im)im2gray(im.Data)<120,Level=3);
Display the mask. h = bigimageshow(bmask); Display the blocked image with the mask as a colored overlay. h = bigimageshow(bim); showlabels(h,bmask, ... AlphaData=bmask, ... Alphamap=[0.8 0]); | Here is code that displays the binary mask and a similar colored
overlay by using the Load the blocked image and create the binary mask. bim = blockedImage("tumor_091R.tif");
bmask = apply(bim,@(im)im2gray(im.Data)<120,Level=3);
Display the mask. im = imageshow(bmask); Display the blocked image with the mask as a colored overlay. im = imageshow(bim, ... OverlayData=bmask, ... OverlayAlphamap=[0.8 0], ... OverlayDisplayRangeMode="data-range", ... OverlayColormap=[0.5 1 0.5]); |
This example uses the Load the blocked image and create the label image. bim = blockedImage("tumor_091R.tif"); cim = gather(bim); cgim = im2gray(cim); numClasses = 4; thresh = multithresh(cgim,numClasses-1); labels = imquantize(cgim,thresh); blabels = blockedImage(labels,WorldStart=bim.WorldStart(3,1:2), ... WorldEnd=bim.WorldEnd(3,1:2)); Display the blocked image with the label overlay. h = bigimageshow(bim); showlabels(h,blabels) | Here is code that displays the blocked image and a similar label
overlay by using the Load the blocked image and create the label image. bim = blockedImage("tumor_091R.tif"); cim = gather(bim); cgim = im2gray(cim); numClasses = 4; thresh = multithresh(cgim,numClasses-1); labels = imquantize(cgim,thresh); blabels = blockedImage(labels,WorldStart=bim.WorldStart(3,1:2), ... WorldEnd=bim.WorldEnd(3,1:2)); Display the blocked image with the label overlay. imageshow(bim,OverlayData=blabels); |
See Also
Apps
Properties
Functions
MATLAB Command
You clicked a link that corresponds to this MATLAB command:
Run the command by entering it in the MATLAB Command Window. Web browsers do not support MATLAB commands.
Select a Web Site
Choose a web site to get translated content where available and see local events and offers. Based on your location, we recommend that you select: .
You can also select a web site from the following list
How to Get Best Site Performance
Select the China site (in Chinese or English) for best site performance. Other MathWorks country sites are not optimized for visits from your location.
Americas
- América Latina (Español)
- Canada (English)
- United States (English)
Europe
- Belgium (English)
- Denmark (English)
- Deutschland (Deutsch)
- España (Español)
- Finland (English)
- France (Français)
- Ireland (English)
- Italia (Italiano)
- Luxembourg (English)
- Netherlands (English)
- Norway (English)
- Österreich (Deutsch)
- Portugal (English)
- Sweden (English)
- Switzerland
- United Kingdom (English)