Backtest with Brinson Attribution to Evaluate Portfolio Performance
This example shows how to compute Brinson attribution using the output of the MATLAB® backtest framework. The backtest framework allows you to build custom trading strategies and then backtest them against historical or simulated market data. The example uses the Brinson attribution function (brinsonAttribution) to explain a portfolio's performance versus a benchmark.
Load Data
Brinson attribution requires that a category is assigned to each asset. Load the dowPortfolio.xlsx data set, then assign each of the 30 stocks to a category.
% Read a table of daily adjusted close prices for 2006 DJIA stocks.
pricesTT = readtimetable('dowPortfolio.xlsx');

% Remove the index from the dataset.
pricesTT= removevars(pricesTT,'DJI');
num_assets = width(pricesTT);

% Set the sectors for each stock.
asset_categories = categorical(["Materials";"Financials";"Financials"; ...
    "Industrials";"Financials";"Industrials";"Materials"; ...
    "Communication Services";"Industrials";"Consumer Discretionary"; ...
    "Consumer Discretionary";"Industrials";"Information Technology"; ...
    "Information Technology";"Information Technology";"Health Care"; ...
    "Financials";"Consumer Staples";"Consumer Discretionary"; ...
    "Industrials";"Consumer Staples";"Health Care"; ...
    "Information Technology";"Health Care";"Consumer Staples"; ...
    "Communication Services";"Industrials";"Communication Services"; ...
    "Consumer Staples";"Energy"]);

% Display the stock categories.
Symbol = pricesTT.Properties.VariableNames(:);
table(Symbol,asset_categories)
ans=30×2 table
     Symbol        asset_categories
    ________    ______________________

    {'AA'  }    Materials
    {'AIG' }    Financials
    {'AXP' }    Financials
    {'BA'  }    Industrials
    {'C'   }    Financials
    {'CAT' }    Industrials
    {'DD'  }    Materials
    {'DIS' }    Communication Services
    {'GE'  }    Industrials
    {'GM'  }    Consumer Discretionary
    {'HD'  }    Consumer Discretionary
    {'HON' }    Industrials
    {'HPQ' }    Information Technology
    {'IBM' }    Information Technology
    {'INTC'}    Information Technology
    {'JNJ' }    Health Care
      ⋮
Define and Create Backtest Strategies
Multiperiod Brinson attribution expects fixed, regular time periods. In this case, the backtest strategy rebalance schedules will match the Brinson periods. You can set the rebalance dates to be monthly starting from January first.
% Rebalance on the first trading day of each month.
rebalance_schedule = datetime(2006,1,1):calmonths(1):datetime(2006,12,1);
for idx = 1:numel(rebalance_schedule)
    priceIdx = find(rebalance_schedule(idx) <= pricesTT.Dates,1,'first');
    rebalance_schedule(idx) = pricesTT.Dates(priceIdx);
end
The risk budgeting strategy needs historical data in order to set initial weights. You can use the first month of price data as a warm-up period to set the initial weights. The backtest begins at the end of the warm-up period.
% Use first month as warm-up period for the risk budgeting strategy.
start_date = rebalance_schedule(2);

% Get the first month of prices to initialize the risk budgeting strategy.
initial_prices = pricesTT(pricesTT.Dates <= start_date,:);
Brinson attribution measures portfolio manager performance against some benchmark. For this example, use a simple equal-weighted strategy as the benchmark. This example examines the performance of the following two strategies relative to this benchmark:
Equal Category — This strategy allocates resources equally per category, and then allocates equal weights for stocks within each category.
Risk Budgeting — This strategy sets weights for stocks with the goal of minimizing each asset's risk contribution.
Create a backtestStrategy object for the benchmark and the two candidate strategies. Define each of these strategies to use the same rebalance schedule and assign the appropriate initial weights.
% Define the Benchmark strategy.
benchmark = backtestStrategy('Benchmark',@equalWeightRebalanceFcn, ...
    'RebalanceFrequency',rebalance_schedule, ...
    'InitialWeights',computeEqualWeights(num_assets), ...
    'UserData',struct());

% Define the equal category strategy.
equalCategory = backtestStrategy('EqualCategory',@equalCategoryRebalanceFcn, ...
    'RebalanceFrequency',rebalance_schedule, ...
    'InitialWeights',computeEqualCategory(asset_categories), ...
    'UserData',struct('Categories',asset_categories));

% Define the risk budgeting strategy.
riskBudgeting = backtestStrategy('RiskBudgeting',@riskBudgetingRebalanceFcn, ...
    'RebalanceFrequency',rebalance_schedule, ...
    'InitialWeights',computeRiskBudgeting(initial_prices));
Use backtestEngine to create a backtestEngine object for the strategies and then use runBacktest to run the backtest. Display the equity curve using equityCurve and then use summary to display the backtest summary table. Both the equal category and risk budgeting strategies outperform the benchmark.
strategies = [benchmark,equalCategory,riskBudgeting];
bt = backtestEngine(strategies);
bt = runBacktest(bt,pricesTT,'Start',start_date);
equityCurve(bt)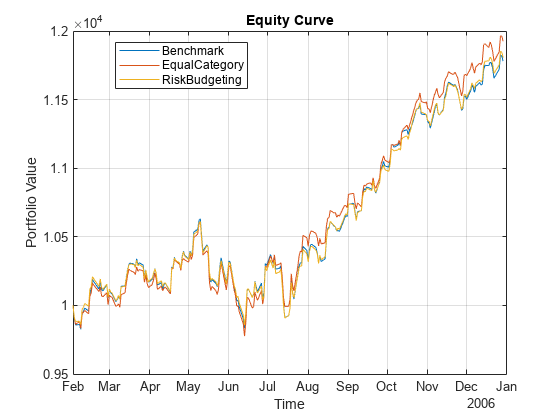
summary(bt)
ans=9×3 table
                       Benchmark     EqualCategory    RiskBudgeting
                       __________    _____________    _____________

    TotalReturn           0.17811        0.19249          0.18065
    SharpeRatio           0.11671        0.12645          0.12393
    Volatility          0.0062905      0.0062211        0.0059849
    AverageTurnover    0.00073556     0.00076049        0.0015965
    MaxTurnover          0.025681       0.028611         0.080538
    AverageReturn      0.00073259     0.00078493       0.00074008
    MaxDrawdown           0.07502       0.078323         0.071364
    AverageBuyCost              0              0                0
    AverageSellCost             0              0                0
Prepare Backtest Results for Brinson Attribution
Set the strategy name of the benchmark.
benchmark_name = 'Benchmark';Define Brinson periods by the rebalance dates and the backtest end date.
period_dates = [rebalance_schedule(2:end), pricesTT.Dates(end)];
Compute Brinson Attribution for Backtested Investment Strategy
Select whether to analyze the equal category or risk budgeting strategy. Then, use the backtest2brinson function in Local Functions to compute asset_table that is formatted for use with the brinsonAttribution function. For more information on the format of the asset_table, see the description for the AssetTable input argument in the brinsonAttribution function.
% Select strategy to analyze strategy_name ="EqualCategory"; asset_table = backtest2brinson(bt,strategy_name,benchmark_name,pricesTT,asset_categories,period_dates); head(asset_table)
    Period    Name      Return             Category           PortfolioWeight    BenchmarkWeight
    ______    _____    _________    ______________________    _______________    _______________

      1       "AA"     -0.050283    Materials                    0.055556           0.033333
      1       "AIG"    0.0015356    Financials                   0.027778           0.033333
      1       "AXP"     0.028439    Financials                   0.027778           0.033333
      1       "BA"      0.022929    Industrials                  0.018519           0.033333
      1       "C"       0.015045    Financials                   0.027778           0.033333
      1       "CAT"     0.074416    Industrials                  0.018519           0.033333
      1       "DD"      0.037791    Materials                    0.055556           0.033333
      1       "DIS"      0.11182    Communication Services       0.037037           0.033333
% Compute Brinson attribution
brinson = brinsonAttribution(asset_table);
summary(brinson)ans=11×1 table
Brinson Attribution Summary
___________________________
Total Number of Assets 30
Number of Assets in Portfolio 30
Number of Assets in Benchmark 30
Number of Periods 11
Number of Categories 9
Portfolio Return 0.19249
Benchmark Return 0.17811
Active Return 0.014376
Allocation Effect 0.014376
Selection Effect 8.5567e-18
Interaction Effect -1.1701e-19
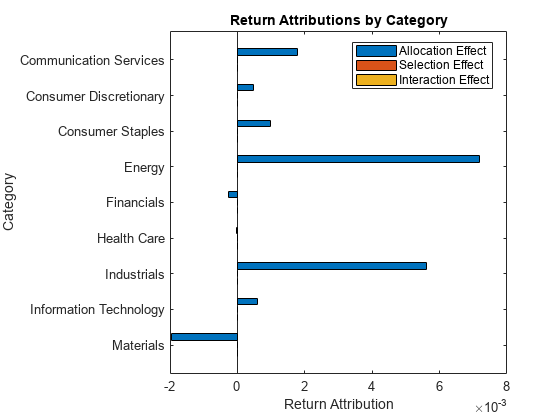
Generate the attribution chart using attributionsChart with the brinson object. The attributions chart creates a horizontal bar chart of portfolio performance attributions by category, aggregated over all time periods.
attributionsChart(brinson)
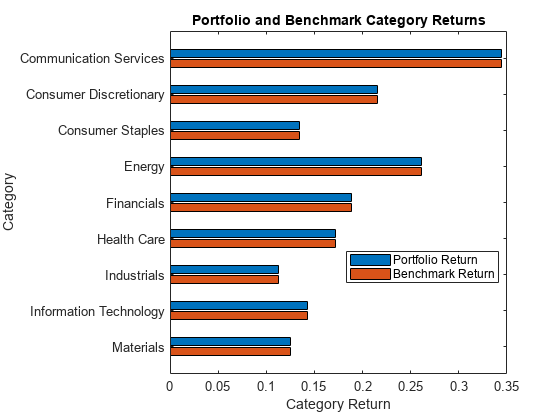
Generate a category returns chart using categoryReturnsChart with the brinson object. The category returns chart creates a horizontal bar chart of portfolio and benchmark category returns, aggregated over all time periods.
categoryReturnsChart(brinson)
Generate a category weights chart using categoryWeightsChart with the brinson object. The category weights chart creates a horizontal bar chart of portfolio, benchmark, and active weights by category, averaged over all time periods.
categoryWeightsChart(brinson)
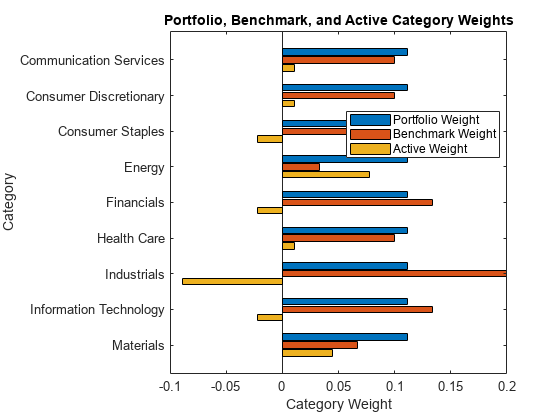
The equal category strategy, despite having different category weights from the benchmark, has the same equal-weighted asset selection process within each category. Therefore, the equal category strategy has no selection or interaction effect (relative to the benchmark). Meanwhile, the risk budgeting strategy disregards the asset categories when setting portfolio weights, so it has selection and interaction effects.
Local Functions
Both the equal asset weight and equal category weight rebalance functions compute a fixed weight that is assigned at each rebalance date. In order to avoid calculating the weights each time, the weights are calculated once and then the result is saved in the UserData struct for the backtestStrategy object. For more information on the UserData struct, see the rebalanceFcn input argument for backtestStrategy.
function [new_weights,user_data] = equalWeightRebalanceFcn(~,pricesTT,user_data)
% Equal asset weight rebalance function

if ~isfield(user_data,'FixedAllocation')
    % If this is the first call to the rebalance function, calculate the
    % desired fixed allocation and save it.
    user_data.FixedAllocation = computeEqualWeights(width(pricesTT));
end
new_weights = user_data.FixedAllocation;

end


function weights = computeEqualWeights(num_assets)
% Equal asset weight portfolio allocation

weights = ones(1,num_assets) / num_assets;

end


function [new_weights,user_data] = equalCategoryRebalanceFcn(~, ~, user_data)
% Equal category weight rebalance function

if ~isfield(user_data,'FixedAllocation')
    % If this is the first call to the rebalance function, calculate the
    % desired fixed allocation and save it.
    user_data.FixedAllocation = computeEqualCategory(user_data.Categories);
end
new_weights = user_data.FixedAllocation;

end


function weights = computeEqualCategory(asset_categories)
% Equal category weight portfolio allocation

weights = zeros(1,numel(asset_categories));
unique_categories = unique(asset_categories);
category_weight = 1 / numel(unique_categories);

for i = 1:numel(unique_categories)
    category_mask = asset_categories == unique_categories(i);
    weights(category_mask) = category_weight / sum(category_mask);
end

end


function new_weights = riskBudgetingRebalanceFcn(~,pricesTT)
% Risk budgeting rebalance function

new_weights = computeRiskBudgeting(pricesTT);

end


function new_weights = computeRiskBudgeting(pricesTT)
% Risk budgeting portfolio allocation

asset_returns = tick2ret(pricesTT);
asset_cov = cov(asset_returns{:,:});
new_weights = riskBudgetingPortfolio(asset_cov);

end


function asset_table = backtest2brinson(bt,strategy_name,benchmark_name,pricesTT,asset_categories,period_dates)
% Build Brinson attribution input asset table based on the results of the
% completed backtest.

% Compute asset returns per period
asset_returns = tick2ret(pricesTT(period_dates,:));
num_periods = height(asset_returns);

% Brinson Return input
Return = asset_returns.Variables';

% Brinson Category input
Category = repmat(asset_categories,1,num_periods);

% Brinson Period input
num_assets = width(pricesTT);
Period = (1:num_periods) .* ones(num_assets,1);

% Brinson Name input
Name = repmat(string(pricesTT.Properties.VariableNames(:)),1,num_periods);

% Benchmark weights
benchmark_positions = bt.Positions.(benchmark_name){period_dates(1:end-1),2:end}';
BenchmarkWeight = benchmark_positions ./ sum(benchmark_positions);

% Strategy weights
portfolio_positions = bt.Positions.(strategy_name){period_dates(1:end-1),2:end}';
PortfolioWeight = portfolio_positions ./ sum(portfolio_positions);

% Aggregate the inputs into the Brinson asset table
asset_table = table(Period(:),Name(:),Return(:),Category(:), ...
    PortfolioWeight(:),BenchmarkWeight(:),...
    VariableNames=["Period","Name","Return","Category", ...
    "PortfolioWeight","BenchmarkWeight"]);
end
See Also
brinsonAttribution | categoryAttribution | categoryReturns | categoryWeights | totalAttribution | summary