categoryWeightsChart
Syntax
Description
categoryWeightsChart( creates a
horizontal bar chart of portfolio, benchmark, and active weights by category, averaged over
all time periods using a BrinsonPAObj)brinsonAttribution
object.
h = categoryWeightsChart(ax,BrinsonPAObj)h.
h
= categoryWeightsChart(___,Name=Value)
Examples
This example shows how to create a brinsonAttribution object that you can then use with the categoryWeightsChart function to generate a bar chart of category weights.
Prepare Data
Create a table for the monthly prices for four assets.
GM =[17.82;22.68;19.37;20.28];
HD = [39.79;39.12;40.67;40.96];
KO = [38.98;39.44;40.00;40.20];
PG = [56.38;57.08;57.76;55.54];
MonthlyPrices  = table(GM,HD,KO,PG);
Use tick2ret to define the monthly returns.
MonthlyReturns = tick2ret(MonthlyPrices.Variables)';
  [NumAssets,NumPeriods] = size(MonthlyReturns);
Define the periods.
Period = ones(NumAssets*NumPeriods,1);
  for k = 1:NumPeriods
      Period(k*NumAssets+1:end,1) = Period(k*NumAssets,1) + 1;
  end
Define the categories (sectors) for the four assets.
Name = repmat(string(MonthlyPrices.Properties.VariableNames(:)),NumPeriods,1);
  Categories = repmat(categorical([ ...
      "Consumer Discretionary"; ...
      "Consumer Discretionary"; ...
      "Consumer Staples"; ...
      "Consumer Staples"]),NumPeriods,1);
Define benchmark and portfolio weights.
BenchmarkWeight = repmat(1./NumAssets.*ones(NumAssets, 1),NumPeriods,1);
PortfolioWeight = repmat([1;0;1;1]./3,NumPeriods,1);
Create AssetTable Input
Create AssetTable as the input for the brinsonAttribution object.
AssetTable = table(Period, Name, ...
    MonthlyReturns(:), Categories, PortfolioWeight, BenchmarkWeight, ...
    VariableNames=["Period","Name","Return","Category","PortfolioWeight","BenchmarkWeight"])
AssetTable=12×6 table
    Period    Name     Return             Category           PortfolioWeight    BenchmarkWeight
    ______    ____    _________    ______________________    _______________    _______________

      1       "GM"      0.27273    Consumer Discretionary        0.33333             0.25
      1       "HD"    -0.016838    Consumer Discretionary              0             0.25
      1       "KO"     0.011801    Consumer Staples              0.33333             0.25
      1       "PG"     0.012416    Consumer Staples              0.33333             0.25
      2       "GM"     -0.14594    Consumer Discretionary        0.33333             0.25
      2       "HD"     0.039622    Consumer Discretionary              0             0.25
      2       "KO"     0.014199    Consumer Staples              0.33333             0.25
      2       "PG"     0.011913    Consumer Staples              0.33333             0.25
      3       "GM"      0.04698    Consumer Discretionary        0.33333             0.25
      3       "HD"    0.0071306    Consumer Discretionary              0             0.25
      3       "KO"        0.005    Consumer Staples              0.33333             0.25
      3       "PG"    -0.038435    Consumer Staples              0.33333             0.25
Create brinsonAttribution Object
Use brinsonAttribution to create the brinsonAttribution object.
BrinsonPAobj = brinsonAttribution(AssetTable)
BrinsonPAobj =
  brinsonAttribution with properties:

                  NumAssets: 4
         NumPortfolioAssets: 3
         NumBenchmarkAssets: 4
                 NumPeriods: 3
              NumCategories: 2
                  AssetName: [4×1 string]
                AssetReturn: [4×3 double]
              AssetCategory: [4×3 categorical]
       PortfolioAssetWeight: [4×3 double]
       BenchmarkAssetWeight: [4×3 double]
    PortfolioCategoryReturn: [2×3 double]
    BenchmarkCategoryReturn: [2×3 double]
    PortfolioCategoryWeight: [2×3 double]
    BenchmarkCategoryWeight: [2×3 double]
            PortfolioReturn: 0.0598
            BenchmarkReturn: 0.0540
               ActiveReturn: 0.0059
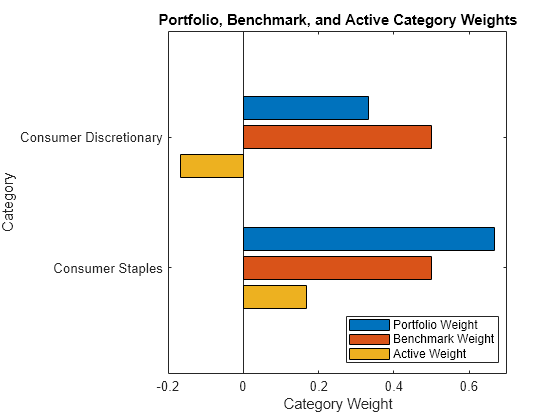
Generate Horizontal Bar Chart for Category Weights
Use the brinsonAttribution object with categoryWeightsChart to generate a horizontal bar chart of portfolio, benchmark, and active weights by category, averaged over all time periods.
categoryWeightsChart(BrinsonPAobj)
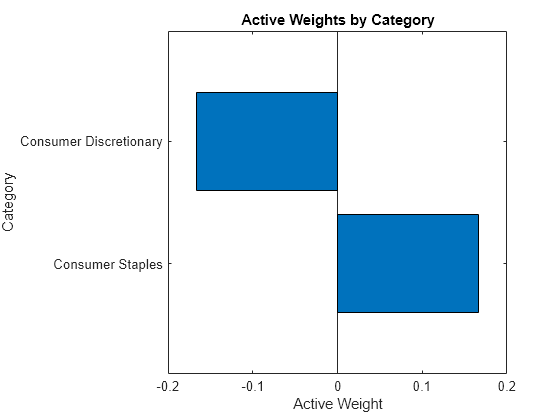
Alternatively, you can use the name-value argument for ActiveOnly to plot only active weights by category.
categoryWeightsChart(BrinsonPAobj,ActiveOnly=true)
Input Arguments
Name-Value Arguments
Output Arguments
Version History
Introduced in R2023a