plot
Description
Add-On Required: This feature requires the Scenario Builder for Automated Driving Toolbox add-on.
plot( plots all the lane
boundary points in the input laneBoundaries)laneBoundarySegment, or laneBoundaryGroup object laneBoundaries.
plot(
specifies options using one or more name-value arguments. For example,
laneBoundaries,Name=Value)LaneBoundaryIDs=laneBoundaryIDs plots only the lane boundary points
that belong to the specified lane boundary IDs laneBoundaryIDs.
axesHandle = plot(___)axes object.
Examples
Load lane boundary segment data into the workspace.
data = load("laneBoundarySegmentData.mat","lbsegment");
Display the lane boundary segment object.
data.lbsegment
ans =
  laneBoundarySegment with properties:

       BoundaryIDs: [4×1 string]
    BoundaryPoints: {4×1 cell}
      BoundaryInfo: []
     NumBoundaries: 4
         NumPoints: 128
      GeoReference: []
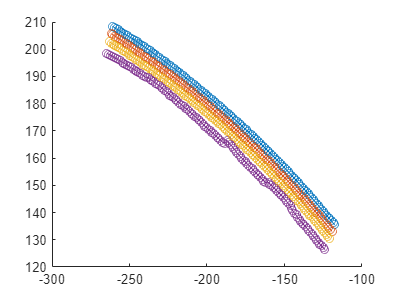
Plot all lane boundary points in the loaded lane boundary segment object.
plot(data.lbsegment)
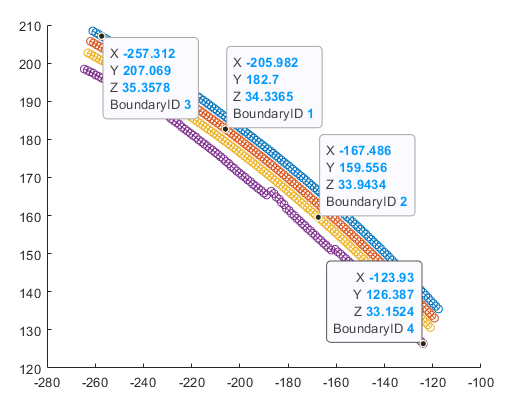
Select a lane boundary point in the figure and observe its relevant information, such as boundary ID.
Load lane boundary data into the workspace
data = load("laneBoundaryGroupData.mat","lbGroup");
Display the lane boundary group object.
lbGroup = data.lbGroup
lbGroup =
  laneBoundaryGroup with properties:

      BoundarySegments: [2×1 laneBoundarySegment]
    SegmentConnections: {[1 2]  [4×2 string]}
        BoundaryGroups: [1×5 struct]
          GeoReference: []
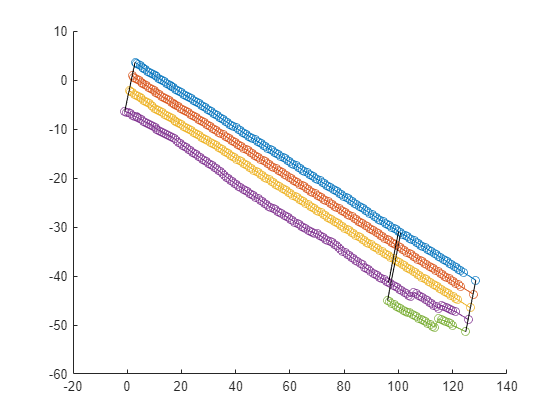
Plot all lane boundary points in the loaded lane boundary group object.
plot(lbGroup)
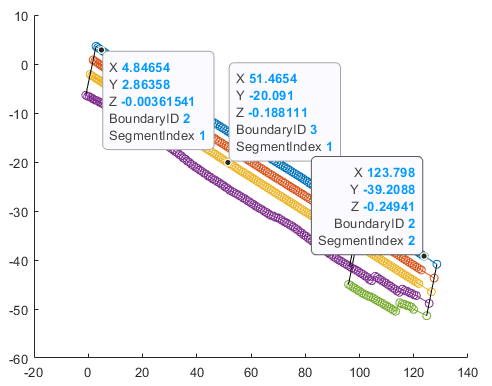
Select a lane boundary point in the figure and observe its relevant information, such as boundary ID and segment index.
Input Arguments
Name-Value Arguments
Output Arguments
Version History
Introduced in R2024a