plotvec
(To be removed) Plot vectors with different colors
plotvec will be removed in a future release. For more information,
see Transition Legacy Neural Network Code to dlnetwork Workflows.
For advice on updating your code, see Version History.
Syntax
plotvec(X,C,M)
Description
plotvec(X,C,M) takes these inputs,
X | Matrix of (column) vectors |
C | Row vector of color coordinates |
M | Marker (default = |
and plots each ith vector in X with a marker
M, using the ith value in C
as the color coordinate.
plotvec(X) only takes a matrix X and plots each
ith vector in X with marker
'+' using the index i as the color
coordinate.
Examples
Plot Vectors with Different Colors
This example shows how to plot four 2-element vectors.
x = [ 0 1 0.5 0.7 ; ...
     -1 2 0.5 0.1];
c = [1 2 3 4];
plotvec(x,c)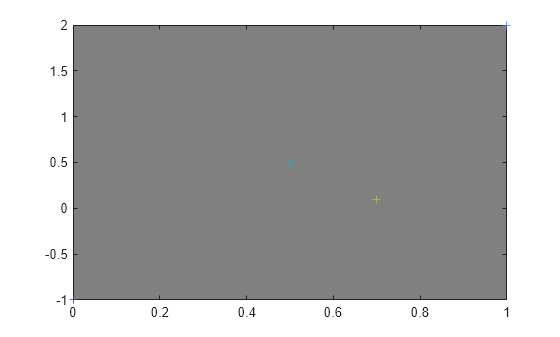
Version History
Introduced before R2006aSee Also
Time Series
Modeler | fitrnet (Statistics and Machine Learning Toolbox) | fitcnet (Statistics and Machine Learning Toolbox) | trainnet | trainingOptions | dlnetwork