4,812 results
hybrid PV and Wind power system
grid integration of hybrid PV and Wind power system.
Maximum power point tracking (MPPT) using different algorithms
Many techniques based MPPT for PV system are proposed in this work1- Perturb and observe method (P&O)2- Incremental conductance method (INC)3- Fuzzy logic based MPPT4- ANN based MPPT
Renewable Energy Based Micro-Grid Power Management System & Economic Unit Commitment through ANFIS intelligent Controller - www.pirc.co.in
In recent years the environmental issues due to increasing greenhouse gases with respect to the growth of industries, vehicle and fossil fuel power generation. The main objective of this research
This charge controller model perform solar photovoltaic Maximum Power Point Tracking to charge lead acid battery
Maximum Power Point Tracking based on Perturbation & Observation algorithm and charge lead acid battery using three stage charging algorithm.Block SettingMPPT Duty Cycle Step SizeSpecify the MPPT duty
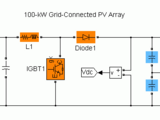
Two demonstrations of a grid-connected PV array using SimPowerSystems.
three-level Voltage Source Converter (VSC). Maximum Power Point Tracking (MPPT) is implemented in the boost converter by means of a Simulink model using the “Incremental Conductance + Integral Regulator
This curriculum module contains interactive examples that teach fundamental concepts of power electronics.
# Power Electronics[](https://www.mathworks.com/matlabcentral/fileexchange/173035-power
Useful tool for rendering and outputting information rich images
Radially averaged surface roughness/topography power spectrum (PSD)
Version 1.2.0.0
Mona Mahboob KanafiCalculates radially averaged 2D power spectrum for a surface roughness/topography
In surface roughness analysis, one of the powerful tools for roughness characterization is surface roughness power spectrum. If the surface under study has isotropic roughness characteristics, then
This repo stores the CubeSat Thermal Power Toolbox installers for MATLAB file exchange
CubeSat Thermal Power ToolboxThis MATLAB App is intended to provide a quick and easy way to perform preliminary thermal and power analysis for CubeSat missions. This is particularly usefull during
This submission provides an entry point into Simscape Electrical for power systems engineers.
# Simscape™ Electrical™ Support Library for Power Systems EngineersVersion 1.0.1[, and Amplitude Spectrum with adjusted FFT
Version 1.3.0.0
Youssef KhmouFFT computes PSD and one sided amplitude spectrum Y[f] of 1d signal
Function [fy]=FFT(y,Fs) 1)computes the Power spectral density and Amplitude spectrum (P(f),F(f)) of 1d signal y(t) with sample rate Fs (Nyquist rate) which is known% apriori. The results are
Finds and plots the linear fit to some data points when plotted on a log scale.
finish with the one that incurs the least error (with error measured as least squares on the linear-linear data.)Notes:A power law relationship[slope, intercept] = logfit(x,y,'loglog
Radially averaged surface roughness power spectrum (PSD) only on top or bottom part of a topography
Version 1.3.0.0
Mona Mahboob KanafiCalculates radially averaged 2D power spectrum for a certain part of surface topography
In surface roughness or any topography analysis, power spectral density graph is a valuable characterisation tool. However, there are times when we are only interested in a specific part of a surface
Simscape Electrical Specialized Power Systems model of a Distance Protection Relay
The distance protection method is widely used for power system transmission line protection. Distance relays are one of the main protection devices in a transmission line. Distance protection relay
SimPowerSystems model of the IEEE 39-bus system, known as the 10-machine New-England Power System
The model is loosely based on the IEEE 39-bus system presented by T. Athay et al for research-oriented studies and educational purposes. The authors of the SimPowerSystems implementation of this
1-dimensional surface roughness power spectrum of a profile or topography
Version 1.6.1.0
Mona Mahboob KanafiCalculates 1D surface roughness power spectrum for a surface topography/or multiple line profiles
In surface roughness analysis, one of the powerful tools for roughness characterization is surface roughness power spectrum (PSD). If you have multiple line scans, for examples obtained by stylus
This submission demonstrates modeling and simulation of a Two-Zone MVDC shipboard power system in Simscape Electrical.
linkhttps://www.esrdc.com/library/documentation-for-a-notional-two-zone-medium-voltage-dc-shipboard-power-system-model-implemented-on-the-rtds/. To get started,Run Two_Zone_MVDC.prjandRead Two_Zone_MVDC_Electric_Ship.pdfFor more information on MathWorks solutions for Power Systems Analysis and Design, please visit this page
Hadi saddat matlab tool box
All (m) files of the prof.Hadi saadat that explain his problems in his famous book Power system analysis
Optimal Power Flow (OPF) Problem version 1 using metaheuristics
The optimal power flow (OPF) problem is the backbone tool for power system operation. The objective of the OPF problem is to determine the optimal operating state of a power system by optimizing a
mpower2 evaluates matrix to an integer power faster than the MATLAB built-in function mpower.
mpower2 evaluates matrix to an integer power faster than the MATLAB built-in function mpower. The speed improvement apparently comes from the fact that mpower does an unnecessary matrix multiply as
Matlab Code of Robust GM-Estimator for Power System State Estimation using Projection Statistics
Version 2.3.0.0
Junbo ZhaoThe matlab code for robust power system state estimation.
Robust power system state estimator is of vital importance for monitoring and control applications. Based on our experience, we find that the robust generalized maximum-likelihood (GM)-estimator
Simulink model used in the "Power Factor Correction Control" MathWorks video
This submission contains a Simulink model and a MATLAB script that was used in the “Power Factor Correction Control” MathWorks video. The model contains a cascaded digital controller for active power
This repository shows how to design various power converter circuits and their corresponding control techniques.
Power Converter Circuit and Control Design with SimscapePower converters are basic building block for various electrification applicationssuch as motor drives, chargers, automobile, aerospace
This program computes the power diagram for a given set of weighted points.
A power diagram is a form of generalized Voronoi diagram, generated by a set of points and their corresponding weights. This program computes the power diagram for a given set of weighted points by
Power Iteration Algorithm for FastICA
This MATLAB package is an implementation of Algorithm 1 proposed in paper below.S. Basiri, E. Ollila and V. Koivunen, "Alternative Derivation of FastICA With Novel Power Iteration Algorithm," in IEEE
more efficient than MATLAB's power function
Compute real, reactive, apparent, power factor and phase angle of a voltage-current pair
Compute real, reactive, apparent, power factor and phase angle (deg) of a voltage-current pair at fundamental Frequency based on the following equations.Real Power = mean(V*I)Reactive Power =
Decoupled active and reactive power control for a three-phase inverter connected to the utility grid based on the PI controller.
# Description:-This repository contains the SIMULINK model to control P and Q of the 3-phase VSI connected to the utility grid. The active power is regulated to track the command value using the PI
Matlab Tensor Tools
GISMO - a framework for scientific research in seismology/infrasound
A simple yet general purpose FVM solver for transient convection diffusion PDE
Model-based design approach for complex electric vehicles
development.This demonstration is described in details in the SimPowerSystems User Guide. The files was previously available in Version Version 5.4 (R2011a). The authors of this work are Olivier Tremblay, Louis-A
Passive Harmonic Filters are generally used in Power System for Harmonic mitigation.
Due to Power Electronic Devices used in Power Conditioning, the quality of Power system is degrading day by day.And hence Passive Shunt filters are designed & implemented through this Simulink
OPF by Vector PSO
A MATLAB toolbox connected with functions of matrices.
Archimedes wrote 3 1/7 > pi > 3 10/71. This is how he did it.
Implementation of the Paper Arbitrage-Free SVI volatility surfaces in Quantitative Finance 14:1
MATLAB Toolbox for working with high-dimensional tensors in the Tensor-Train (TT)-format
A class for efficient manipulation of N-fold Kronecker products in terms of their operands only.
(.\), mldivide (\), mrdivide (/), inv, pinv, power, mpower, norm, sum, cond, eig, svd, abs, nnz, orth, chol, lu, qr, full, sparse, ... Some restrictions apply to these overloads. In particular
This code implements a power flow calculation for a power system network, augmented with a Unified Power Flow Controller (UPFC).
The code performs a power flow calculation for a power system network while incorporating the functionality of a Unified Power Flow Controller (UPFC). The UPFC is a flexible AC transmission system
This is how to visualize power system analysis result in a similar way to electric system softwares.
reactive power in buses and lines. These results as matrices are being demonstrated as figures like every conventional analysis, then a graphic visualization of the grid and analysis result is being appeared
A better, transparent memmapfile, with complex number support.
Management of data tables, similar to dataframe in R, with enhanced plotting facilities.
MATLAB implementation demonstrates the application of a Unified Power Flow Controller (UPFC) to enhance voltage stability in a power system.
This MATLAB code presents an implementation of a UPFC, a versatile device used for real and reactive power control in electrical networks to enhance voltage stability. The code defines system
The STK is a (not so) Small Toolbox for Kriging
A free MATLAB toolbox for formulating and solving sums of squares (SOS) optimization programs.
MATLAB example to make RF Power measurements using an Agilent RF Power Meter
automated measurements and tests.This example shows you how you can use MATLAB to control an Agilent RF Power Meter, make measurements, and retrieve the data into MATLAB and calculate a mean value of the
Linear circuit simulator using network analysis, useful for analog and RF, including noisy 2-ports.
Applications from the text: Classical Mechanics with Matlab applications by Javier E Hasbun, Jones &
Variational Bayesian Monte Carlo (VBMC) algorithm for Bayesian posterior and model inference in MATLAB
Maximum power point tracer algorithm is implemented for PV system
perturb and observe based MPPT algorithm is implemented to track maximum power from PV system
Freely generate data, identify models, and visualize results using over 50 (physics-informed) data-driven approaches.
# Daline: A Generalized Data-driven Power Flow Linearization Platform**Official Website:** https://www.shuo.science/daline**Version:** 1.1.7**Authors:** [Mengshuo
Compute the Evolutionary Power Spectral Density (EPSD) as an alternative to the spectrogram
Evolutionary Power Spectral Density (EPSD)SummaryThe Evolutionary Power Spectral Density (EPSD) [1] is compared to the well-known spectrogram implemented in Matlab. The EPSD produces a smoother
Power Flow Analysis Toolbox & Introduction to Power Flow Analysis Toolbox(PFATB)
PFATB, which stands for Power Flow Analysis Toolbox, is a package of MATLAB M-files. It is a collection of routines, written mostly in m-files, which implement the most important functionsto compute
Class for tagging values with units. Provides for transparent conversion, unit checking & combining.
Class of matrix-like objects with on-the-fly definable methods.
Get the answers and plots for various formulaes of power electronics.
This program is written for the purpose of observing the behaviour of various power devices like rectifier,ac controllers,convertors,switches etc.Most parts of the program offer solution to typical


