How to duplicate field chart?

9 Comments
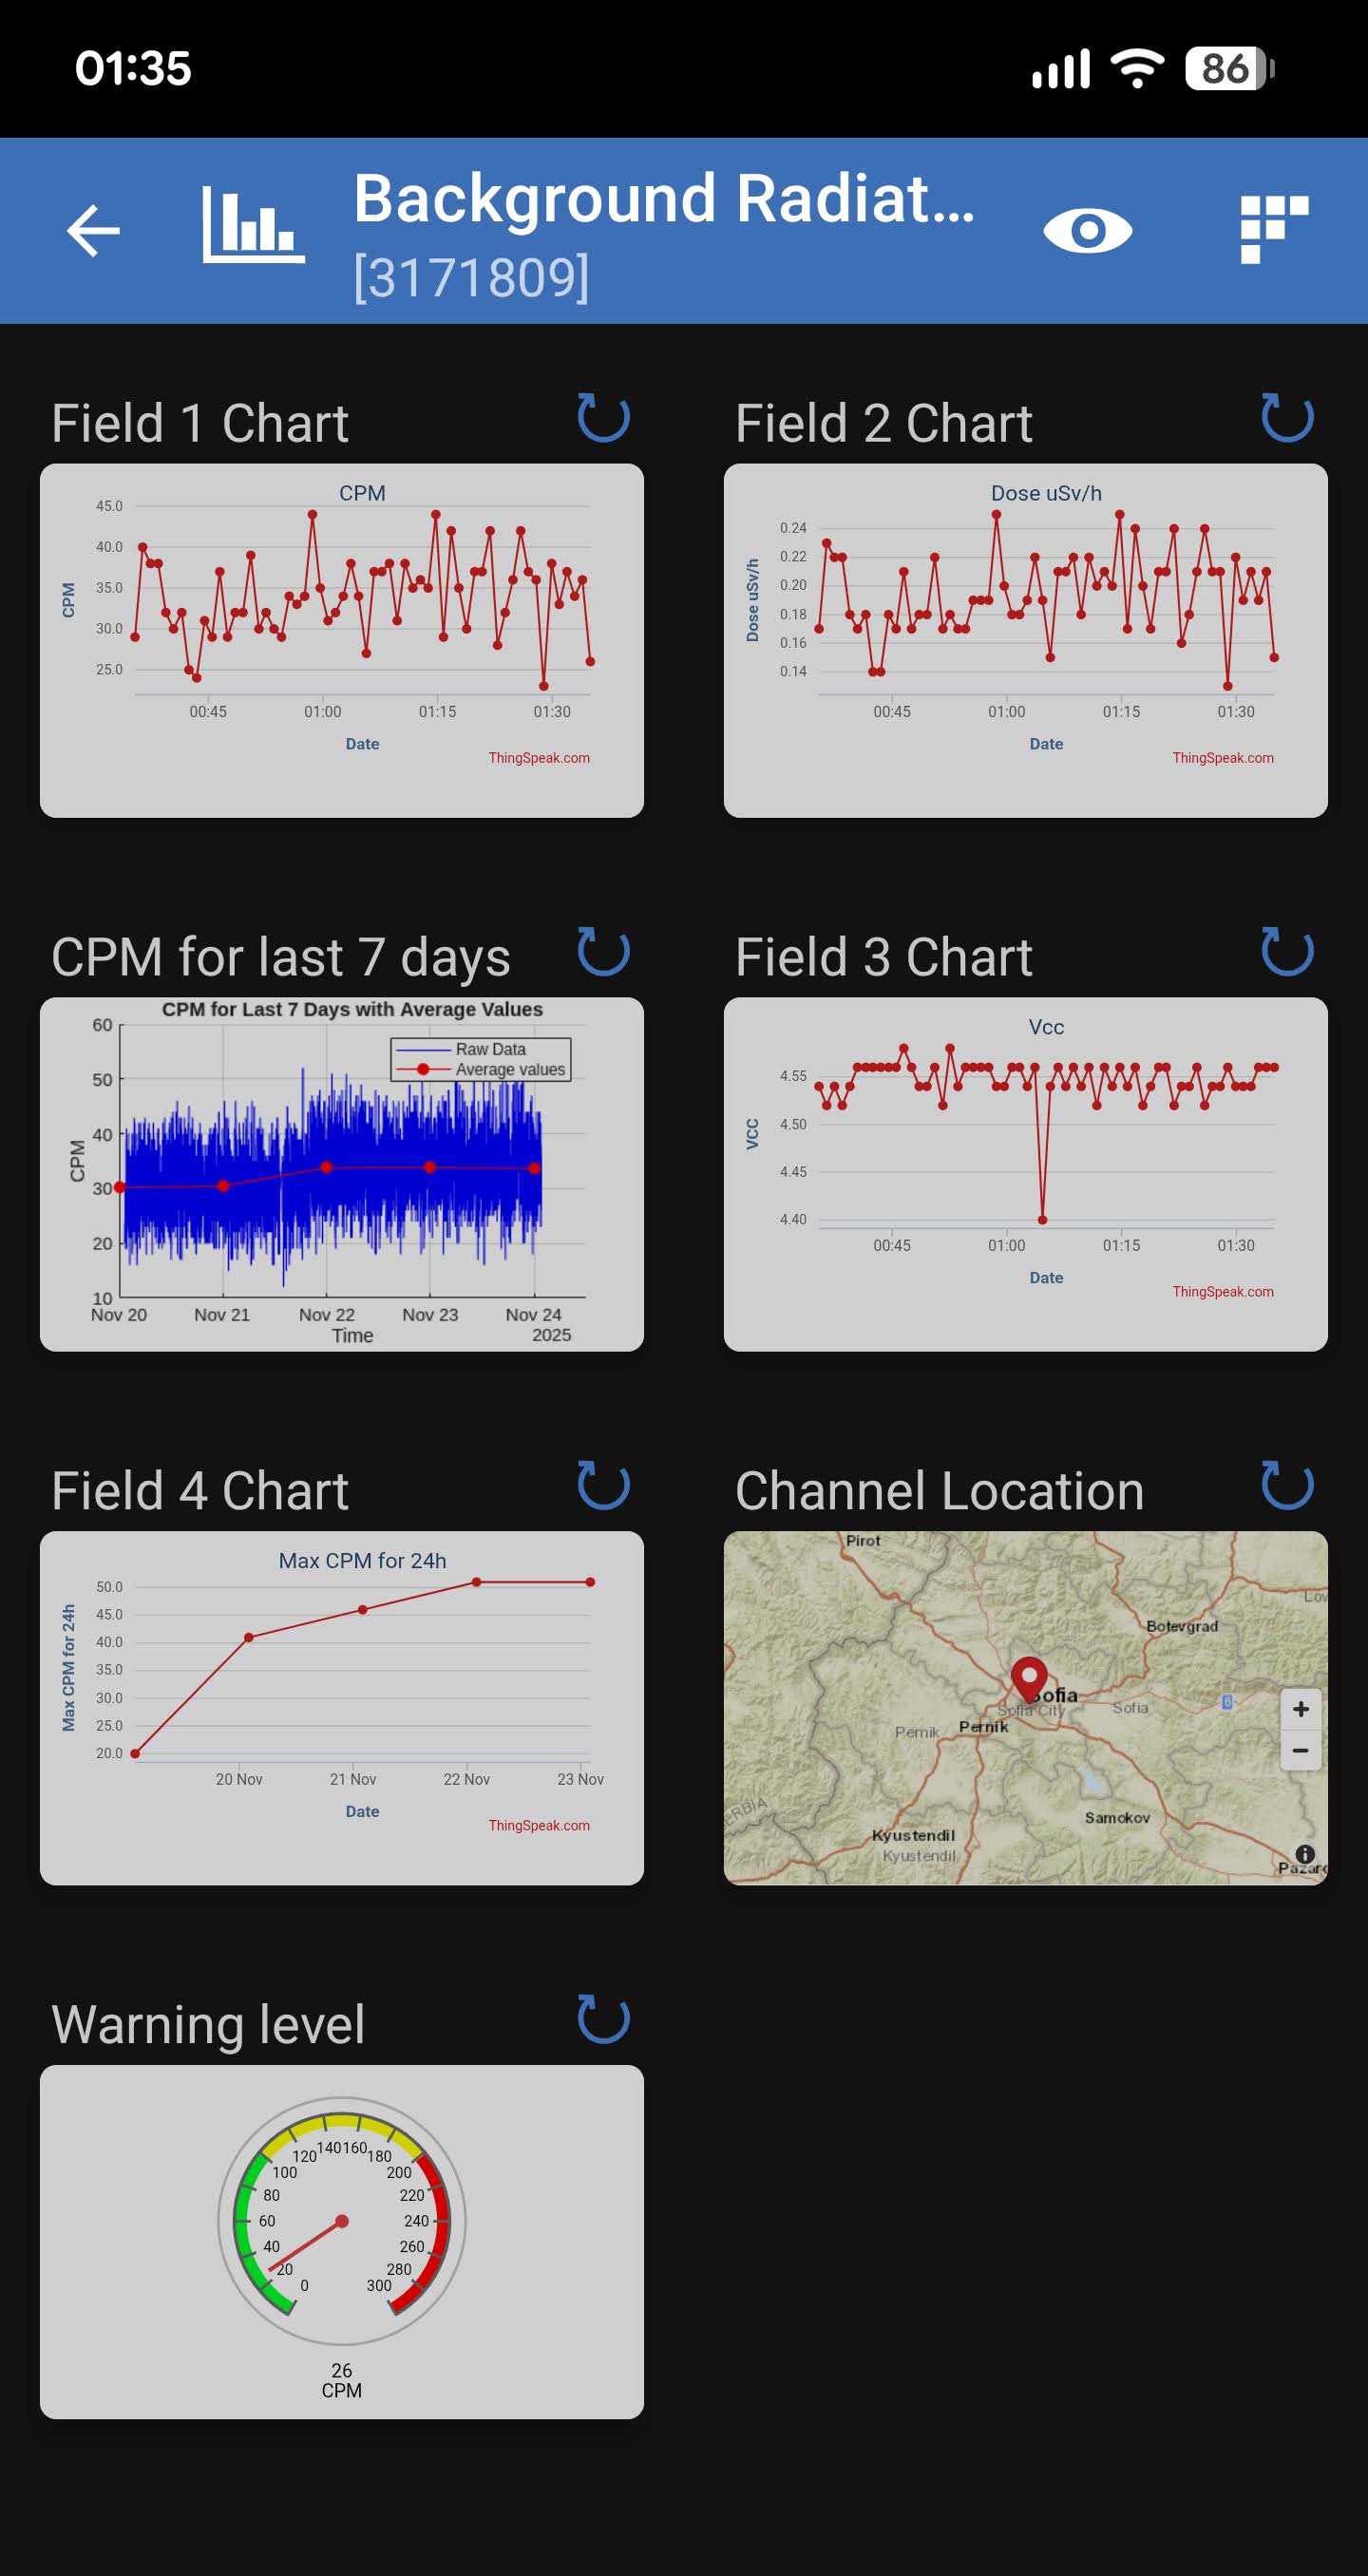
Time DescendingYeah, you said it better - just wanted to add a field plot that uses the same field 1 data (red rectangle on the picture above). Currently, the plot set to use that field is showing readings for an one hour back. I want to make another plot, that uses the same field 1, but this time will set it to show reading for a week, or month etc. I hope I managed to explain it understandable. If not, sorry, I'm a physician, not a coder (if that's an excuse at all hahah).
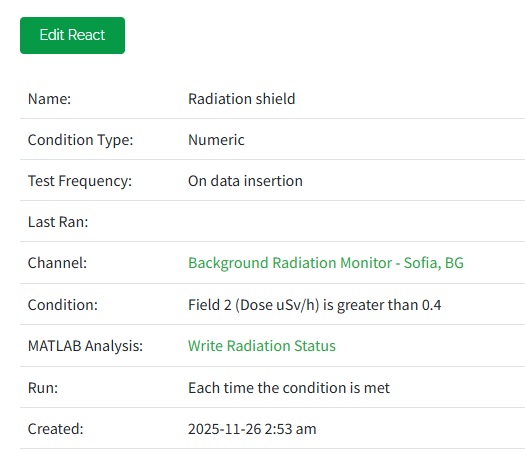
Didn't know I could set weekly reports, nice! Have to do some research on that option with React app. Is it part of MATHLab or it's separate app? Thanks!
Many thanks for your answer! I'll try to figure out what's needed and how to work with the info you provided. AI is a good suggestion, since the coding needed here isn't sounds like rocket science. Yeah, it's still beyond my knowledge, but it looks very doable with some ai help. Will definitely give you a feedback.