Results for


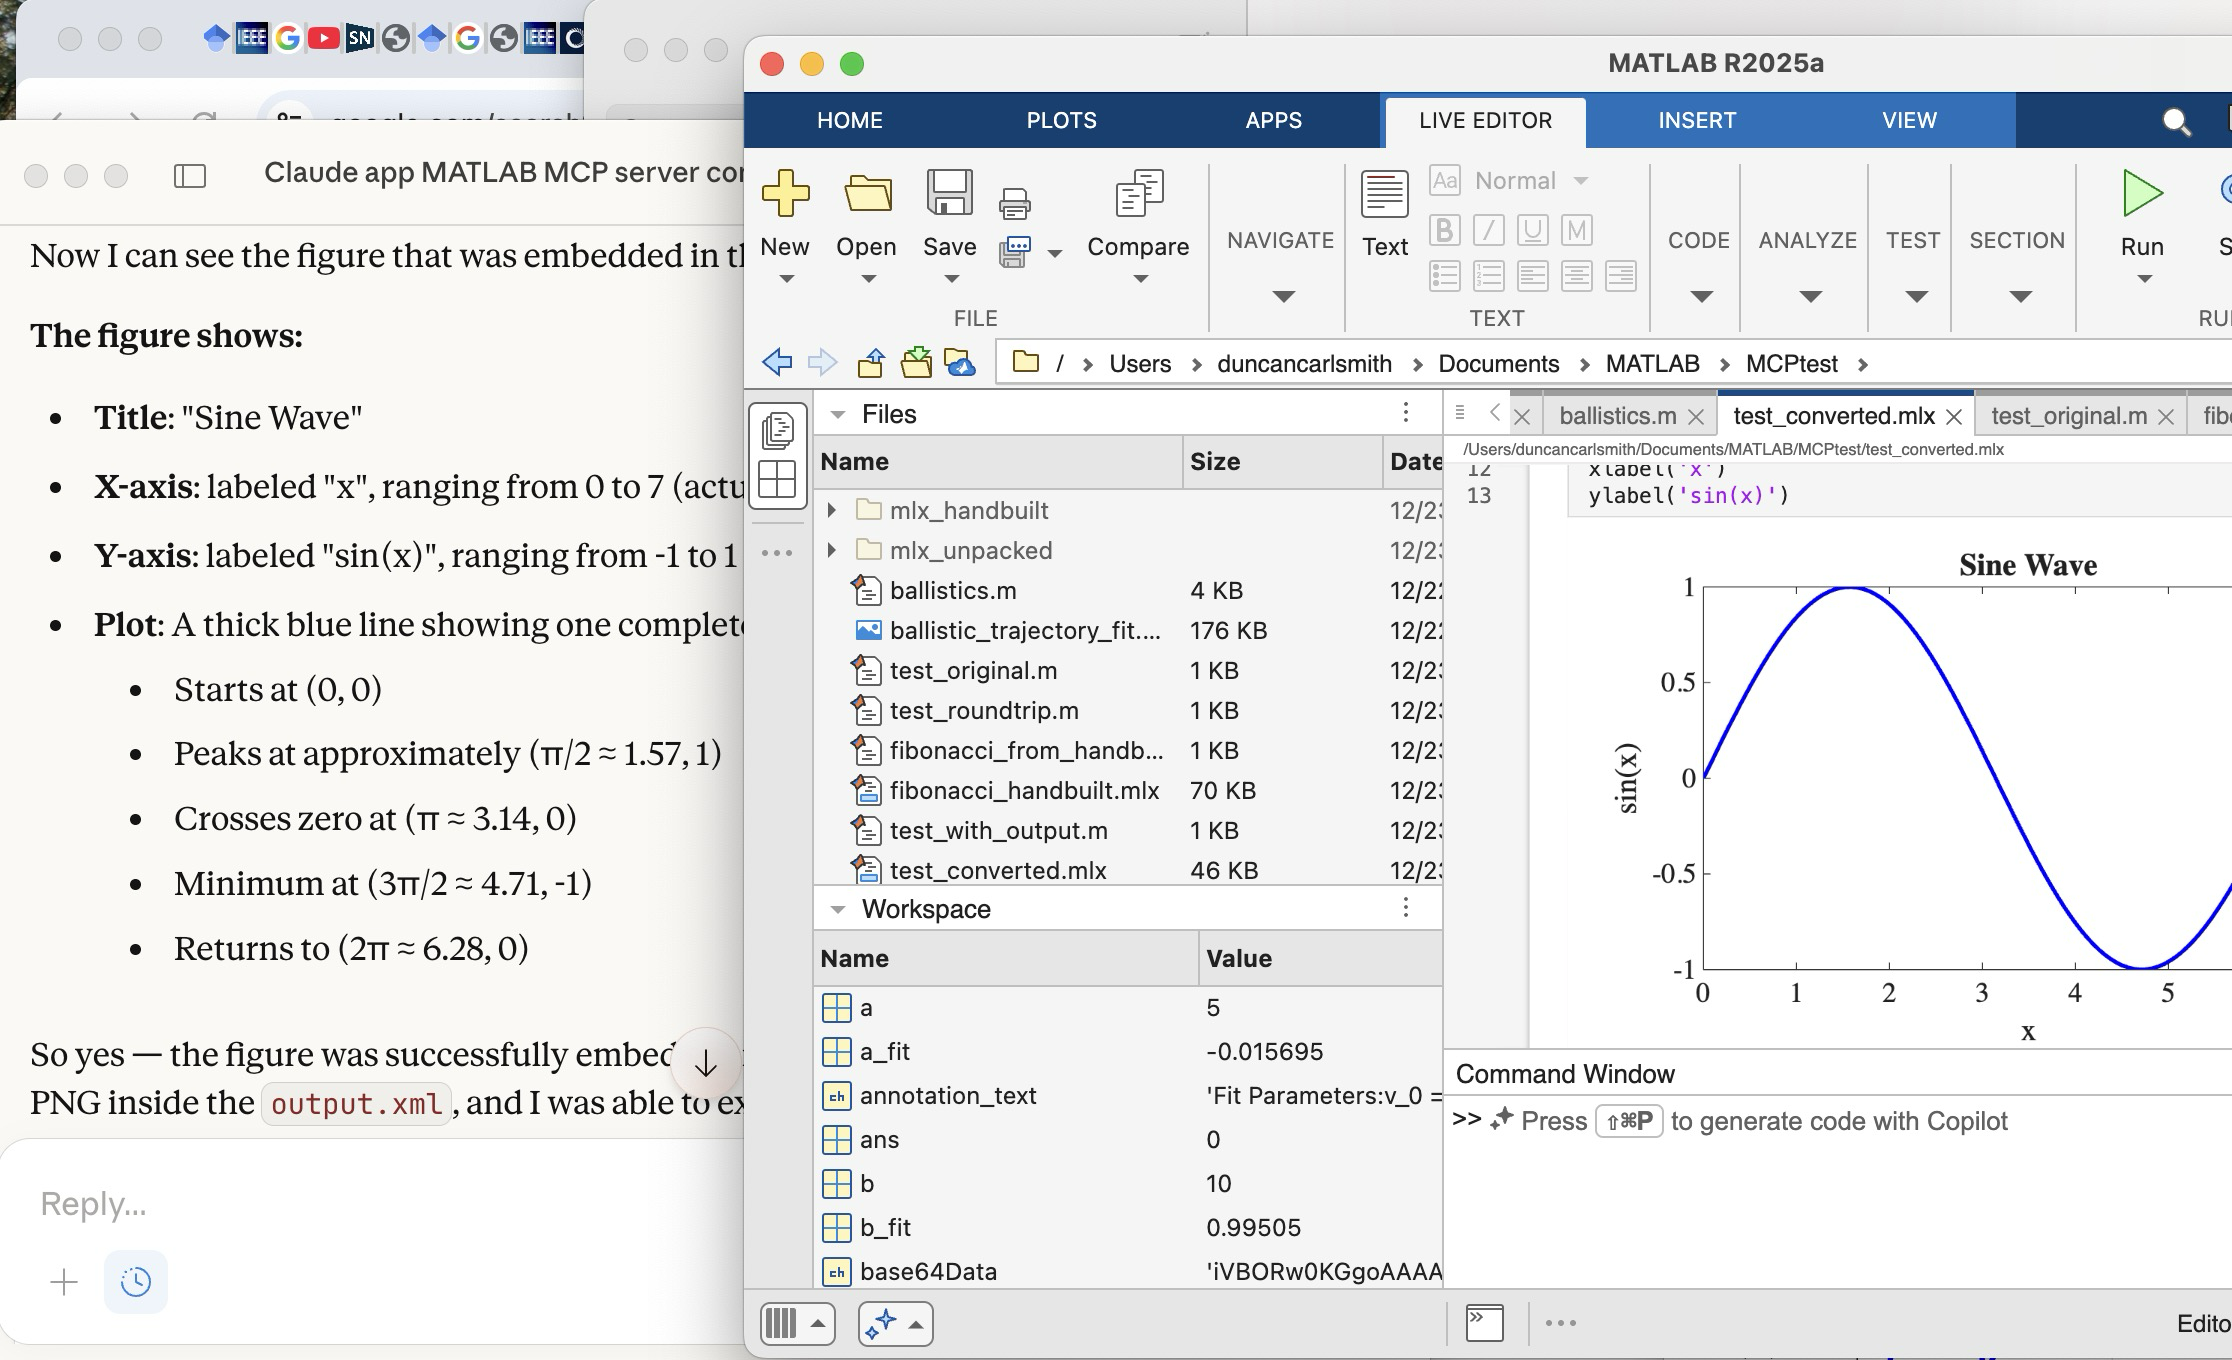
- Chat interface: The window where you type and read responses
- MCP client: A bridge that connects the remote Claude model to local tools
- You type your request in Claude Desktop App
- Claude Desktop → Anthropic (HTTPS): Your message travels to Anthropic's servers, along with a list of available tools from your MCP servers
- Claude processes (on Anthropic's servers): The model decides to use the evaluate_matlab_code tool and generates a tool-use request
- Anthropic → Claude Desktop (HTTPS): The response arrives containing the tool request
- Claude Desktop → MCP Server (stdio pipe): The app writes a JSON-RPC message to the MATLAB MCP server's stdin
- MCP Server executes: The server runs your code in MATLAB and captures the output
- MCP Server → Claude Desktop (stdio pipe): Results written to stdout
- Claude Desktop → Anthropic (HTTPS): Tool results sent back to Claude
- Claude formulates response (on Anthropic's servers)
- Anthropic → Claude Desktop → You: Final response displayed
- No cross-talk: Claude Desktop cannot communicate with Perplexity's MCP servers (or vice versa). Each app only talks to its own children via stdio pipes.
- Shared backends: Both apps' MCP servers can make requests to the same Ollama server or MATLAB instance — they're just independent clients of those services.
- No app launching: Claude cannot launch, control, or send commands to Perplexity App. They are peer applications, not parent-child.
- Orchestrate local tools via MCP servers it spawns and controls
- Call any cloud API (Perplexity, OpenAI, custom services) via HTTP through fetch MCP or MATLAB
- Share backend services (Ollama, MATLAB) with other apps that happen to use them
- Coordinate multi-AI workflows by sending prompts to local models (via Ollama) and cloud APIs, then synthesizing their responses

- Missing --matlab-root argument → "no valid MATLAB environments found"

Building Transition Matrices for the Royal Game of Err
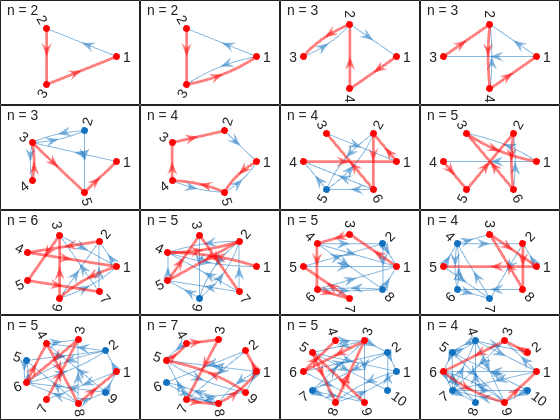
King Neduchadneddar the Procrastinator has devised yet another scheme to occupy his court's time, and this one is particularly devious. The Royal Game of Err involves moving pawns along a path of n squares by rolling an m-sided die, with forbidden squares thrown in just to keep things interesting. Your mission, should you choose to accept it, is to construct a transition matrix that captures all the probabilistic mischief of this game. But here's the secret: you don't need nested loops or brute force. With the right MATLAB techniques, you can build this matrix with the elegance befitting a Chief Royal Mage of Matrix Computations.
The heart of this problem lies in recognizing that the transition matrix is dominated by a beautiful superdiagonal pattern. When you're on square j and roll the die, you have a 1/m chance of moving to each of squares j+1, j+2, up to j+m, assuming none are forbidden and you don't overshoot. This screams for vectorized construction rather than element-by-element assignment. The key weapon in your arsenal is MATLAB's ability to construct multiple diagonals simultaneously using either repeated calls to diag with offset parameters, or the more powerful spdiags function for those comfortable with advanced matrix construction.
Consider this approach: start with a zero matrix and systematically add 1/m to each of the m superdiagonals. For a die with m sides, you're essentially saying "from square j, there's a 1/m probability of landing on j+k for k = 1 to m." This can be accomplished with a simple loop over k, using T = T + diag(ones(1,n-k)*(1/m), k) for each offset k from 1 to m. The beauty here is that you're working with entire diagonals at once, not individual elements. This vectorized approach is not only more elegant but also more efficient and less error-prone than tracking indices manually.
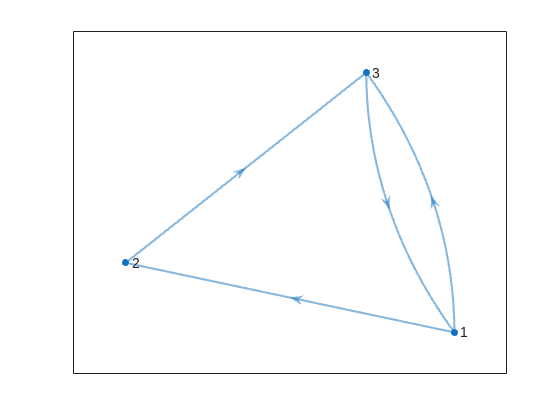
Figure 1: Basic transition matrix structure for n=8, m=3, no forbidden squares. Notice the three superdiagonals carrying probability 1/3 each.
Now comes the interesting part: handling forbidden squares. When square j is forbidden, two things must happen simultaneously. First, you cannot land ON square j from anywhere, which means column j should be entirely zeros. Second, you cannot move FROM square j to anywhere, which means row j should be entirely zeros. The naive approach would involve checking each forbidden square and carefully adjusting individual elements. The elegant approach recognizes that MATLAB's logical indexing was practically designed for this scenario.
Here's the trick: once you've built your basic superdiagonal structure, handle all forbidden squares in just two lines: T(nogo, :) = 0 to eliminate all moves FROM forbidden squares, and T(:, nogo) = 0 to eliminate all moves TO forbidden squares. But wait, there's more. When you zero out these entries, the probabilities that would have gone to those squares need to be redistributed. This is where the "stay put" mechanism comes in. If rolling a 3 would land you on a forbidden square, you stay where you are instead. This means adding those lost probabilities back to the main diagonal.
The sophisticated approach uses logical indexing to identify which transitions would have violated the forbidden square rule, then redirects those probabilities to the diagonal. You can check if a move from square j to square k would hit a forbidden square using ismember(k, nogo), and if so, add that 1/m probability to T(j,j) instead. This "probability conservation" ensures that each row still sums to 1, maintaining the stochastic property of your transition matrix.
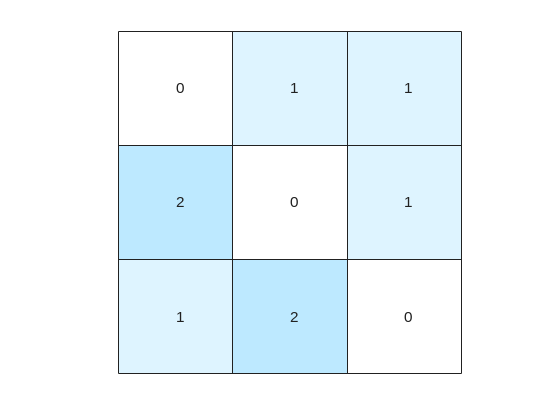
Figure 2: Transition matrix with forbidden squares marked. Left: before adjustment. Right: after forbidden square handling showing probability redistribution. Compare the diagonal elements.
The final square presents its own challenge. Once you reach square n, the game is over, which in Markov chain terminology means it's an "absorbing state." This is elegantly represented by setting T(n,n) = 1 and ensuring T(n, j) = 0 for all j not equal to n. But there's another boundary condition that's equally important: what happens when you're on square j and rolling the die would take you beyond square n?
The algorithm description provides a clever solution: you stay put. If you're on square n-2 and roll a 4 on a 6-sided die, you don't move. This means that for squares near the end, the diagonal element T(j,j) needs to accumulate probability from all those "overshooting" scenarios. Mathematically, if you're on square j and rolling k where j+k exceeds n, that 1/m probability needs to be added to T(j,j). A clean way to implement this is to first build the full superdiagonal structure as if the board were infinite, then add (1:m)/m to the last m elements of the diagonal to account for staying put.
There's an even more elegant approach: build your superdiagonals only up to where they're valid, then explicitly calculate how much probability should stay on the diagonal for each square. For square j, count how many die outcomes would either overshoot n or hit forbidden squares, multiply by 1/m, and add to T(j,j). This direct calculation ensures you've accounted for every possible outcome and maintains the row-sum property.
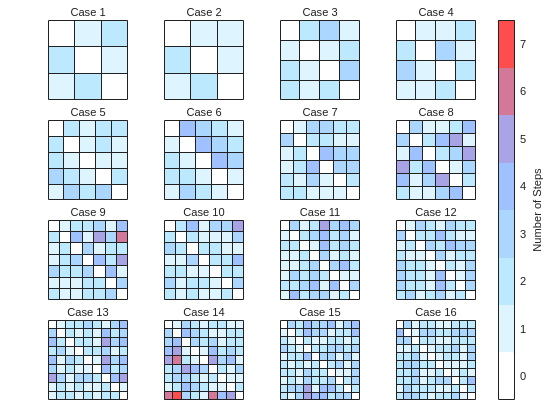
Figure 3: Heat map showing probability distributions from different starting squares. Notice how probabilities "pile up" at the diagonal for squares near the boundary.
Now that you understand the three key components, the construction strategy becomes clear. Initialize your n-by-n zero matrix. Build the basic superdiagonal structure to represent normal movement. Identify and handle forbidden squares by zeroing rows and columns, then redistributing lost probability to the diagonal. Finally, ensure boundary conditions are met by setting the final square as absorbing and handling the "stay put" cases for near-boundary squares.
The order matters here. If you handle forbidden squares first and then build diagonals, you might overwrite your forbidden square adjustments. The cleanest approach is to build all m superdiagonals first, then make a single pass to handle both forbidden squares and boundary conditions simultaneously. This can be done efficiently with a vectorized check: for each square j, count valid moves, calculate stay-put probability, and update T(j,j) accordingly.
Figure 4: Complete transition matrix for a test case with n=7, m=4, nogo=[2 5]. Spy plot showing the sparse structure alongside a color-coded heat map. Notice the complex pattern of probabilities.
Before declaring victory over King Neduchadneddar, verify your matrix satisfies the fundamental properties of a transition matrix. First, every element should be between 0 and 1 (probabilities, after all). Second, each row should sum to exactly 1, representing the fact that from any square, you must end up somewhere (even if it's staying put). You can check this with all(abs(sum(T,2) - 1) < 1e-10) to account for floating-point arithmetic.
The provided test cases offer another validation opportunity. Start with the simplest cases where patterns are obvious, like n=8, m=3 with no forbidden squares. You should see a clean superdiagonal structure. Then progress to cases with forbidden squares and verify that columns and rows are properly zeroed. The algorithm description even provides example matrices for you to compare against. Pay special attention to the diagonal elements, as they're where most of the complexity hides.
Figure 5: Validation dashboard showing row sums (should all be 1), matrix properties, and comparison with expected structure for a simple test case.
For those seeking to optimize their solution, consider that for large n, explicitly storing an n-by-n dense matrix becomes memory-intensive. Since most elements are zero, MATLAB's sparse matrix format is ideal. Replace zeros(n) with sparse(n,n) at initialization. The same indexing and diagonal operations work seamlessly with sparse matrices, but you'll save considerable memory for large problems.
Another sophistication involves recognizing that the transition matrix construction is fundamentally about populating a banded matrix with some modifications. The spdiags function was designed for exactly this scenario. You can construct all m superdiagonals in a single call by preparing a matrix where each column represents one diagonal's values. While the syntax takes some getting used to, the resulting code is remarkably compact and efficient.
For debugging purposes, visualizing your matrix at each construction stage helps immensely. Use imagesc(T) with a colorbar to see the probability distribution, or spy(T) to see the non-zero structure. If you're not seeing the expected patterns, these visualizations immediately reveal whether your diagonals are in the right positions or if forbidden squares are properly handled.
Figure 6: Performance comparison showing construction time and memory usage for dense vs sparse implementations as n increases.
King Neduchadneddar may have thought he was creating an impossible puzzle, but armed with MATLAB's matrix manipulation prowess, you've seen that elegant solutions exist. The key insights are recognizing the superdiagonal structure, handling forbidden squares through logical indexing rather than explicit loops, and carefully managing boundary conditions to ensure probability conservation. The transition matrix you've constructed doesn't just solve a Cody problem; it represents a complete probabilistic model of the game that could be used for further analysis, such as computing expected game lengths or steady-state probabilities.
The beauty of this approach lies not in clever tricks but in thinking about the problem at the right level of abstraction. Rather than considering each element individually, you've worked with entire diagonals, rows, and columns. Rather than writing conditional logic for every special case, you've used vectorized operations that handle all cases simultaneously. This is the essence of MATLAB mastery: letting the language's strengths work for you rather than against you.
As Vasilis Bellos demonstrated with the Bridges of Nedsburg , sometimes the most satisfying part of a Cody problem isn't just getting the tests to pass, but understanding the mathematical structure deeply enough to implement it elegantly. King Neduchadneddar would surely be impressed by your matrix manipulation skills, though he'd probably never admit it. Now go forth and construct those transition matrices with the confidence of a true Chief Royal Mage of Matrix Computations. The court awaits your solution.
Note: This article provides strategic insights and techniques for solving Problem 61067 without revealing the complete solution. The figures reference MATLAB Mobile script created by me that demonstrate key concepts. For the full Cody Contest 2025 experience and to test your implementation, visit the problem page and may your matrices always be stochastic.
- If a player has a card, no other player has it
- If a player has ncards confirmed, they have no other cards
- If (n - 1) cards in a category are located, the nth card is in the envelope
- If a player has (3n - ncards) confirmed cards that they don't have, they must have the remaining unknown cards
- across all players for a given card and category, with K(card, category, :) (needed for rule 1)
- about the cards that a given player holds in his hand: K(:, :, player) yields a 2d slice of size n by 3 (needed for rules 2 and 4)
- of the location of the n-1 cards for each category: K(:, category, :) (needed for rule 3)
- to count the YESs : sum( K > 0)
- to count the NOs : sum( K == 0 )
- to find the last remaining NOs : find( K(…) == 0)
- to count the MAYBEs or YESs (the “not NOs”) : sum( abs(K(…)) ) or sum( K(…) ~= 0 )
- to convert MAYBE into YES with information from the turns without modifying other cards’ statuses : K( … ) = abs(K( … )) or K(…) = K( … ).^2
- to convert MAYBE into NO once a card is located elsewhere without modifying other cards’ statuses : K(…) = max(0, K( … ))
- to count the YESs : sum( K > 0)
- to count the NOs : sum( K < 0 )
- to find the last remaining NOs : find( K(…) < 0)
- to count the MAYBEs or YESs (the “not NOs”) : sum( K(…) >= 0)
- to convert MAYBE into YES with information from the turns without modifying other cards’ statuses : K(… ) = min(1, 2*K(…) + 1)
- to convert MAYBE into NO once a card is located elsewhere without modifying other cards’ statuses : K(…) = max(-1, (2*K(…) - 1 )) (already used in Matt Tearle’s Solution 14843428)
- to convert MAYBE into YES with information from the turns without modifying other cards’ statuses : K(…) = 2 * K(…) (such a simple function!)
- to convert MAYBE into NO once a card is located elsewhere without modifying other cards’ statuses : K(…) = bitand(K(…), 254), which was later optimised and became even simpler after several iterations.
- Use this File Exchange submission to get the size of your solution: https://fr.mathworks.com/matlabcentral/fileexchange/34754-calculate-size
- Use existing MATLAB functions that may already perform the desired calculations but that you might have overlooked (as I did with histcount and digraph).
- Use vectorization amply. It’s what make the MATLAB language so concise and elegant!
- Before creating a matrix of replicated values, check if your operation requires it. See Compatible Array Sizes for Basic Operations. For example, you can write x == y with x being a column vector and y a row vector, thereby obtaining a 2 by 2-matrix.
- Try writing out for loops instead of vectorization. Sometimes it’s actually smaller from a Cody point of view.
- Avoid nested functions and subfunctions. Try anonymous functions if used in several places. (By all means, DO write nested functions and subfunctions in real life!)
- Avoid variable assignments. If you declare variables, look for ones you can use in multiples places for multiple purposes. If you have a variable used only in one place, replace it with its expression where you need it. (Do not do this in real life!)
- Instead of variable assignments, write hardcoded constants. (Do not do this in real life!)
- Instead of indexed assignments, look for a way to use multiplying or exponentiating with logical indexes. (For example, compare Solution 14896297 and Solution 14897502 for Problem 61069. Clueless - Lord Ned in the Game Room with the Technical Computing Language).
- Replace x == 0 with ~x if x is a numeric scalar or vector or matrix that doesn’t contain any NaN (the latter is smaller in size by 1)
- Instead of x == -1, see if x < 0 works (smaller in size by 1).
- Instead of [1 2], write 1:2 (smaller in size by 1).
- “sum(sum(x))” is actually smaller than “sum(x, 1:2)”
- Instead of initialising a matrix of 2s with 2 * ones(m,n), write repmat(2,m,n) (smaller in size by 1).
- If you have a matrix x and wish to initialize a matrix of 1s, instead of ones(size(x)), write x .^ 0 (works as long as x doesn’t contain any NaN) (smaller in size by 2).
- Unfortunately, x ^-Inf doesn’t provide any reduction compared to zeros(size(x)), and it doesn’t work when x contains 0 or 1.
- Beware of Operator Precedence and avoid unnecessary parenthesis (special thanks to @Stefan Abendroth for bringing that to my attention ;)) :
- Instead of x * (y .^ 2), write x * y .^2 (smaller in size by 1).
- Instead of x > (y == z), write y == z < x (smaller in size by 1).