predict
Syntax
Description
predictedY = predict(Mdl,TestTbl)Mdl.Horizon for the
observations in the time span covered by TestTbl. Before predicting,
the function uses the test data TestTbl to prepare lagged and leading
predictors. Then, for each horizon step in the direct forecasting model
Mdl, the function uses the corresponding model in
Mdl.Learners to predict the response.
predictedY = predict(Mdl,TestX,TestY)TestX and
the test set response data TestY. This syntax assumes that
Mdl uses exogenous predictors and lagged response variables as
predictors. That is, Mdl.PredictorNames and
Mdl.ResponseLags are nonempty.
predictedY = predict(Mdl,TestX)Mdl does not use lagged
response variables as predictors. That is, Mdl.ResponseLags must be
empty.
predictedY = predict(Mdl,TestY)Mdl does not use exogenous
predictors. That is, Mdl.PredictorNames must be empty.
Examples
After creating a DirectForecaster object, see how the model performs on observed test data by using the predict object function. Then use the model to forecast at time steps beyond the available data by using the forecast object function.
Load the sample file TemperatureData.csv, which contains average daily temperatures from January 2015 through July 2016. Read the file into a table. Observe the first eight observations in the table.
temperatures = readtable("TemperatureData.csv");
head(temperatures)
Year Month Day TemperatureF
____ ___________ ___ ____________
2015 {'January'} 1 23
2015 {'January'} 2 31
2015 {'January'} 3 25
2015 {'January'} 4 39
2015 {'January'} 5 29
2015 {'January'} 6 12
2015 {'January'} 7 10
2015 {'January'} 8 4
For this example, use a subset of the temperature data that omits the first 100 observations.
Tbl = temperatures(101:end,:);
Create a datetime variable t that contains the year, month, and day information for each observation in Tbl. Then, use t to convert Tbl into a timetable.
numericMonth = month(datetime(Tbl.Month, ...
    InputFormat="MMMM",Locale="en_US"));
t = datetime(Tbl.Year,numericMonth,Tbl.Day);
Tbl.Time = t;
Tbl = table2timetable(Tbl);
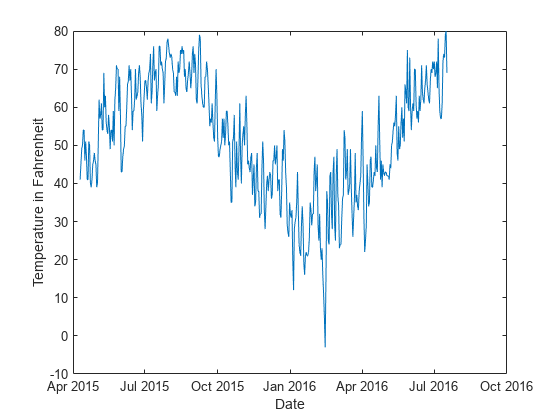
Plot the temperature values in Tbl over time.
plot(Tbl.Time,Tbl.TemperatureF)
xlabel("Date")
ylabel("Temperature in Fahrenheit")
Partition the temperature data into training and test sets by using tspartition. Reserve 20% of the observations for testing.
partition = tspartition(size(Tbl,1),"Holdout",0.20);
trainingTbl = Tbl(training(partition),:);
testTbl = Tbl(test(partition),:);
Create a full direct forecasting model by using the data in trainingTbl. Train the model using a decision tree learner. All three of the predictors (Year, Month, and Day) are leading predictors because their future values are known. To create new predictors by shifting the leading predictor and response variables backward in time, specify the leading predictor lags and the response variable lags.
Mdl = directforecaster(trainingTbl,"TemperatureF", ...
    Learner="tree", ...
    LeadingPredictors="all",LeadingPredictorLags={0:1,0:1,0:7}, ...
    ResponseLags=1:7)
Mdl =
  DirectForecaster

                  Horizon: 1
             ResponseLags: [1 2 3 4 5 6 7]
        LeadingPredictors: [1 2 3]
     LeadingPredictorLags: {[0 1]  [0 1]  [0 1 2 3 4 5 6 7]}
             ResponseName: 'TemperatureF'
           PredictorNames: {'Year'  'Month'  'Day'}
    CategoricalPredictors: 2
                 Learners: {[1×1 classreg.learning.regr.CompactRegressionTree]}
                   MaxLag: 7
          NumObservations: 372


  Properties, Methods
Mdl is a DirectForecaster model object. By default, the horizon is one step ahead. That is, Mdl predicts a value that is one step into the future.
For each test set observation, predict the temperature value using Mdl.
predictedY = predict(Mdl,testTbl)
predictedY=93×1 timetable
       Time        TemperatureF_Step1
    ___________    __________________

    16-Apr-2016          49.398
    17-Apr-2016          39.419
    18-Apr-2016          39.419
    19-Apr-2016          45.333
    20-Apr-2016          35.867
    21-Apr-2016          34.222
    22-Apr-2016          45.333
    23-Apr-2016          66.392
    24-Apr-2016          44.111
    25-Apr-2016              49
    26-Apr-2016              49
    27-Apr-2016          34.222
    28-Apr-2016          43.333
    29-Apr-2016          34.222
    30-Apr-2016          34.222
    01-May-2016          34.222
      ⋮
Plot the true response values and the predicted response values for the test set observations.
plot(testTbl.Time,testTbl.TemperatureF)
hold on
plot(predictedY.Time,predictedY.TemperatureF_Step1,"--")
hold off
legend("True","Predicted",Location="southeast")
xlabel("Date")
ylabel("Temperature in Fahrenheit")
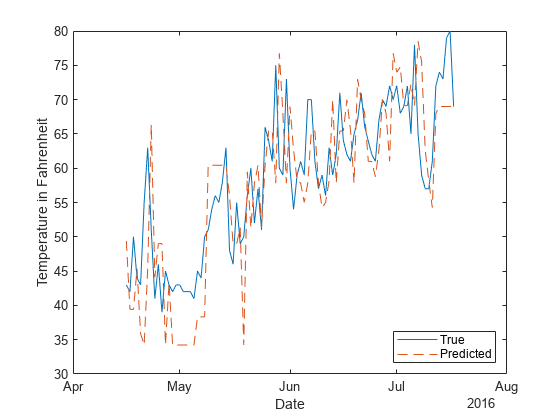
Overall, the direct forecasting model is able to predict the trend in temperatures.
Retrain the direct forecasting model using the training and test data. To forecast temperatures one week beyond the available data, specify the horizon steps as one to seven steps ahead.
finalMdl = directforecaster(Tbl,"TemperatureF", ...
    Learner="tree", ...
    LeadingPredictors="all",LeadingPredictorLags={0:1,0:1,0:7}, ...
    ResponseLags=1:7,Horizon=1:7)
finalMdl =
  DirectForecaster

                  Horizon: [1 2 3 4 5 6 7]
             ResponseLags: [1 2 3 4 5 6 7]
        LeadingPredictors: [1 2 3]
     LeadingPredictorLags: {[0 1]  [0 1]  [0 1 2 3 4 5 6 7]}
             ResponseName: 'TemperatureF'
           PredictorNames: {'Year'  'Month'  'Day'}
    CategoricalPredictors: 2
                 Learners: {7×1 cell}
                   MaxLag: 7
          NumObservations: 465


  Properties, Methods
finalMdl is a DirectForecaster model object that consists of seven regression models: finalMdl.Learners{1}, which predicts one step into the future; finalMdl.Learners{2}, which predicts two steps into the future; and so on.
Because finalMdl uses the unshifted values of the leading predictors Year, Month, and Day as predictor values, you must specify these values for the specified horizon steps in the call to forecast. For the week after the last available observation in Tbl, create a timetable forecastData with the year, month, and day values.
forecastTime = Tbl.Time(end,:)+1:Tbl.Time(end,:)+7;
forecastYear = year(forecastTime);
forecastMonth = month(forecastTime,"name");
forecastDay = day(forecastTime);
forecastData = timetable(forecastTime',forecastYear', ...
    forecastMonth',forecastDay',VariableNames=["Year","Month","Day"])
forecastData=7×3 timetable
       Time        Year     Month      Day
    ___________    ____    ________    ___

    18-Jul-2016    2016    {'July'}    18
    19-Jul-2016    2016    {'July'}    19
    20-Jul-2016    2016    {'July'}    20
    21-Jul-2016    2016    {'July'}    21
    22-Jul-2016    2016    {'July'}    22
    23-Jul-2016    2016    {'July'}    23
    24-Jul-2016    2016    {'July'}    24
Forecast the temperature at each horizon step using finalMdl.
forecastY = forecast(finalMdl,Tbl,LeadingData=forecastData)
forecastY=7×1 timetable
       Time        TemperatureF
    ___________    ____________

    18-Jul-2016       62.375
    19-Jul-2016         64.5
    20-Jul-2016       66.889
    21-Jul-2016       66.889
    22-Jul-2016         70.5
    23-Jul-2016        74.25
    24-Jul-2016        74.25
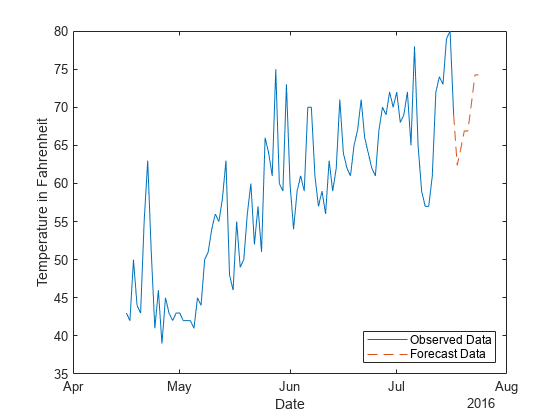
Plot the observed temperatures for the test set data and the forecast temperatures.
plot(testTbl.Time,testTbl.TemperatureF)
hold on
plot([testTbl.Time(end);forecastY.Time], ...
    [testTbl.TemperatureF(end);forecastY.TemperatureF],"--")
hold off
legend("Observed Data","Forecast Data", ...
    Location="southeast")
xlabel("Date")
ylabel("Temperature in Fahrenheit")
Input Arguments
Output Arguments
Limitations
When you use the
predictobject function, the test set data must contain at leastMdl.MaxLag + max(Mdl.Horizon)observations. The software requires these observations for creating lagged and leading predictors.
Version History
Introduced in R2023b