interactionplot
Interaction plot for grouped data
Syntax
Description
interactionplot(
creates a two-factor interaction plot for the group means of Y,group)Y with
groups defined by the entries in group. The interaction plot is a
matrix plot, with the number of rows and columns both equal to the number of grouping
variables. Each subplot shows the group means of Y as a function of one
grouping variable. The grouping variable names appear on the diagonal of the plot matrix.
The plot at off-diagonal position (i,j) is the
interaction of the two variables whose names are given at row diagonal
(i,i) and column diagonal
(j,j), respectively.
interactionplot(
specifies additional options using one or more name-value arguments. For example, you can
specify the grouping variable names, and whether to display the full matrix of interaction
plots.Y,group,Name=Value)
Examples
Randomly generate data for a response variable y.
y = randn(1000,1);
Randomly generate data for four three-level factors.
group = ceil(3*rand(1000,4));
Create an interaction plot matrix for the factors, and label the factors 'A', 'B', 'C', and 'D'.
interactionplot(y,group,VarNames={'A','B','C','D'})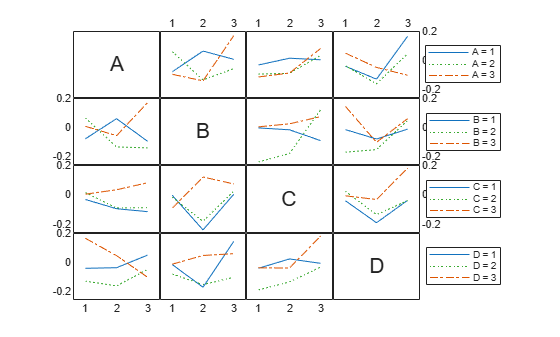
The figure contains a matrix of subplots, where each subplot shows the mean response for different values of the grouping variables A, B, C, and D.
Display the interaction plots and omit the duplicate panels.
interactionplot(y,group,VarNames={'A','B','C','D'},Full=false)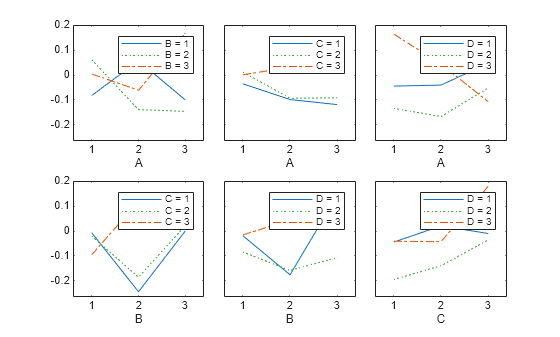
The plot displays only the unique panels of the full interaction plot matrix.
Copyright 2015 The MathWorks, Inc.