Main Content

multivarichart

Multivari chart for grouped data

Syntax

multivarichart(y,GROUP)
multivarichart(Y)
multivarichart(...,param1,val1,param2,val2,...)
multivarichart(fig,___)
[charthandle,AXESH] = multivarichart(...)

Description

multivarichart(y,GROUP) displays the multivari chart for the vector y grouped by entries in GROUP that can be a cell array or a matrix. If GROUP is a cell array, then each cell in GROUP must contain a grouping variable that is a categorical vector, numeric vector, character matrix, string array, or single-column cell array of character vectors. If GROUP is a numeric matrix, then its columns represent different grouping variables. Each grouping variable must have the same number of elements as y. The number of grouping variables must be 2, 3, or 4.

Each subplot of the plot matrix contains a multivari chart for the first and second grouping variables. The x-axis in each subplot indicates values of the first grouping variable. The legend at the bottom of the figure window indicates values of the second grouping variable. The subplot at position (i,j) is the multivari chart for the subset of y at the ith level of the third grouping variable and the jth level of the fourth grouping variable. If the third or fourth grouping variable is absent, it is considered to have only one level.

multivarichart(Y) displays the multivari chart for a matrix Y. The data in different columns represent changes in one factor. The data in different rows represent changes in another factor.

multivarichart(...,param1,val1,param2,val2,...) specifies one or more of the following name/value pairs:

  • 'varnames' — Grouping variable names in a character matrix, a string array, or a cell array of character vectors, one per grouping variable. Default names are 'X1', 'X2', ... .

  • 'plotorder''sorted' or a vector containing a permutation of the integers from 1 to the number of grouping variables.

    If 'plotorder' is 'sorted', the grouping variables are rearranged in descending order according to the number of levels in each variable.

    If 'plotorder' is a vector, it indicates the order in which each grouping variable should be plotted. For example, [2,3,1,4] indicates that the second grouping variable should be used as the x-axis of each subplot, the third grouping variable should be used as the legend, the first grouping variable should be used as the columns of the plot, and the fourth grouping variable should be used as the rows of the plot.

multivarichart(fig,___) plots into the figure specified by fig instead of the current figure (gcf) using any of the input argument combinations in the previous syntaxes. (since R2024a)

[charthandle,AXESH] = multivarichart(...) returns a handle charthandle to the figure window and a matrix AXESH of handles to the subplot axes.

Examples

collapse all

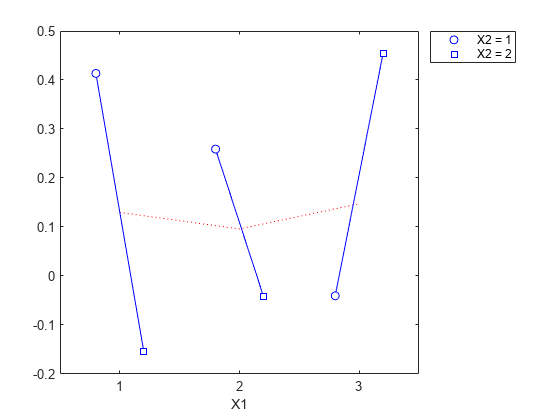
Display a multivari chart for data with two grouping variables.

rng default; % For reproducibility
y = randn(100,1); % Randomly generate response 
group = [ceil(3*rand(100,1)) ceil(2*rand(100,1))]; 
multivarichart(y,group)

Figure contains an axes object. The axes object with xlabel X1 contains 2 objects of type line. One or more of the lines displays its values using only markers These objects represent X2 = 1, X2 = 2.

Display a multivari chart for data with four grouping variables.

y = randn(1000,1); % Randomly generate response
group = {ceil(2*rand(1000,1)),ceil(3*rand(1000,1)), ...
         ceil(2*rand(1000,1)),ceil(3*rand(1000,1))};
multivarichart(y,group)

Figure contains 8 axes objects and another object of type uicontainer. Axes object 1 with title X3 = 1, ylabel X4 = 1 contains 3 objects of type line. One or more of the lines displays its values using only markers Axes object 2 with title X3 = 2 contains 3 objects of type line. One or more of the lines displays its values using only markers Axes object 3 with ylabel X4 = 2 contains 3 objects of type line. One or more of the lines displays its values using only markers Axes object 4 contains 3 objects of type line. One or more of the lines displays its values using only markers Axes object 5 with xlabel X1, ylabel X4 = 3 contains 3 objects of type line. One or more of the lines displays its values using only markers Axes object 6 with xlabel X1 contains 3 objects of type line. One or more of the lines displays its values using only markers Axes object 7 with xlabel X1 contains 2 objects of type line. One or more of the lines displays its values using only markers These objects represent X2 = 1, X2 = 2. Hidden axes object 8 contains 3 objects of type line. One or more of the lines displays its values using only markers These objects represent X2 = 1, X2 = 2, X2 = 3.

Version History

Introduced in R2006b

expand all

Go to top of page