Main Content

biplot

Description

biplot(coefs) creates a biplot of the coefficients in the matrix coefs. The biplot is 2-D if coefs has two columns or 3-D if it has three columns. The axes in the biplot represent the columns of coefs, and the vectors in the biplot represent the rows of coefs (the observed variables).

example

biplot(coefs,Name,Value) specifies additional options using one or more name-value pair arguments. For example, you can specify 'Positive','true' to restrict the biplot to the positive quadrant (in 2-D) or octant (in 3-D).

example

biplot(ax,___) uses the plot axes specified by the Axes object ax. Specify ax as the first input argument followed by any of the input argument combinations in the previous syntaxes.

example

h = biplot(___) returns a column vector of handles to the graphics objects created by biplot. Use h to query and modify properties of specific graphics objects. For more information, see Graphics Object Properties.

example

Examples

collapse all

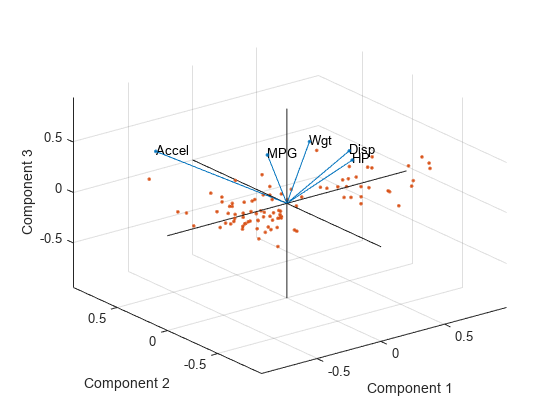
Create a biplot of the first three principal component coefficients, the observations, and the observed variables for the carsmall data set.

Load the sample data.

load carsmall

Create a matrix consisting of the variables Acceleration, Displacement, Horsepower, MPG, and Weight. Delete rows in the matrix that have missing values.

X = [Acceleration Displacement Horsepower MPG Weight];
X = rmmissing(X);

Standardize X and perform a principal component analysis.

Z = zscore(X); % Standardized data
[coefs,score] = pca(Z);

The 5-by-5 matrix coefs contains the principal component coefficients (one column for each principal component). The matrix score contains the principal component scores (the observations).

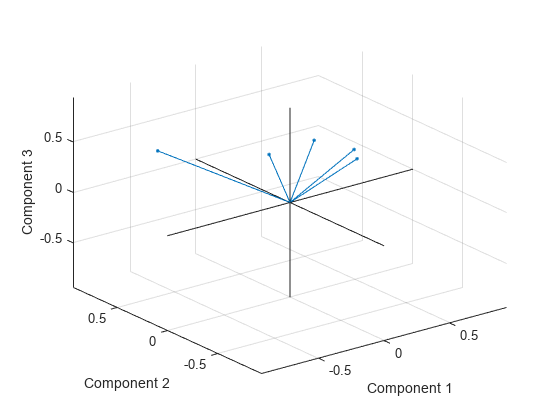
Create a biplot of the first three principal component coefficients. The axes of the biplot represent the columns of coefs, and the vectors in the biplot represent the rows of coefs.

biplot(coefs(:,1:3))

Figure contains an axes object. The axes object with xlabel Component 1, ylabel Component 2 contains 3 objects of type line. One or more of the lines displays its values using only markers

Create a more detailed biplot by labeling each variable and plotting the observations in the space of the first three principal components.

vbls = {'Accel','Disp','HP','MPG','Wgt'}; % Labels for the variables
biplot(coefs(:,1:3),'Scores',score(:,1:3),'VarLabels',vbls);

Figure contains an axes object. The axes object with xlabel Component 1, ylabel Component 2 contains 9 objects of type line, text. One or more of the lines displays its values using only markers

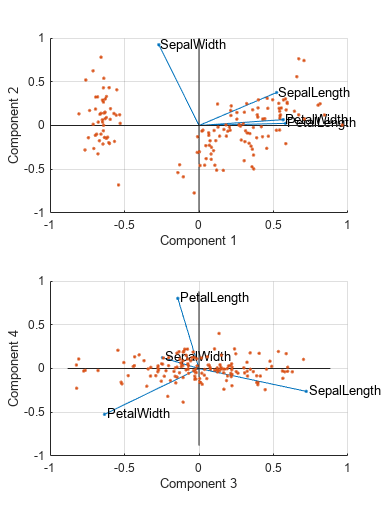
Load the fisheriris data set, standardize the flower measurements in meas, and perform a principal component analysis.

load fisheriris
Z = zscore(meas);
[coefs,scores] = pca(Z);

Create a figure with two subplots and return the Axes objects as ax1 and ax2. Create a biplot in each set of axes by referring to the corresponding Axes object. In the top subplot, display a biplot using the first two principal components. In the bottom subplot, display a biplot using the third and fourth principal components. Specify the x-axis and y-axis limits by passing the corresponding Axes objects to the xlim and ylim functions. Change the x-axis and y-axis labels in the bottom plot by passing ax2 to xlabel and ylabel.

figure('Units','normalized','Position',[0.3 0.3 0.3 0.5])
variables = {'SepalLength','SepalWidth','PetalLength','PetalWidth'};
ax1 = subplot(2,1,1); % Top subplot
biplot(ax1,coefs(:,1:2),'Scores',scores(:,1:2),'VarLabels',variables);
xlim(ax1,[-1 1])
ylim(ax1,[-1 1])

ax2 = subplot(2,1,2); % Bottom subplot
biplot(ax2,coefs(:,3:4),'Scores',scores(:,3:4),'VarLabels',variables);
xlim(ax2,[-1 1])
ylim(ax2,[-1 1])
xlabel(ax2,'Component 3')
ylabel(ax2,'Component 4')

Figure contains 2 axes objects. Axes object 1 with xlabel Component 1, ylabel Component 2 contains 8 objects of type line, text. One or more of the lines displays its values using only markers Axes object 2 with xlabel Component 3, ylabel Component 4 contains 8 objects of type line, text. One or more of the lines displays its values using only markers

Control the appearance of a biplot by specifying supported line property names and values, and by using handles to the graphics objects created by biplot.

Load the sample data.

load carsmall

Create a matrix consisting of the variables Acceleration, Displacement, and MPG. Delete rows in the matrix that have missing values.

X = [Acceleration Displacement MPG];
X = rmmissing(X);

Standardize X and perform a principal component analysis.

Z = zscore(X); % Standardized data
[coefs,score] = pca(Z);

The 3-by-3 matrix coefs contains the principal component coefficients (one column for each principal component). The matrix score contains the principal component scores (the observations).

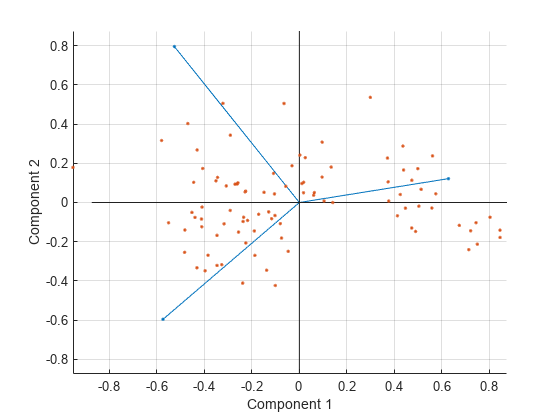
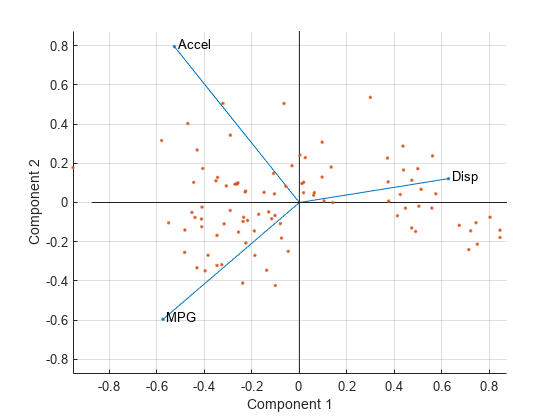
Create a biplot of the observations in the space of the first two principal components. Use the default properties for the biplot.

h = biplot(coefs(:,1:2),'Scores',score(:,1:2));

Figure contains an axes object. The axes object with xlabel Component 1, ylabel Component 2 contains 101 objects of type line.

h is a vector of handles to graphics objects. You can modify the properties of the line objects returned by biplot.

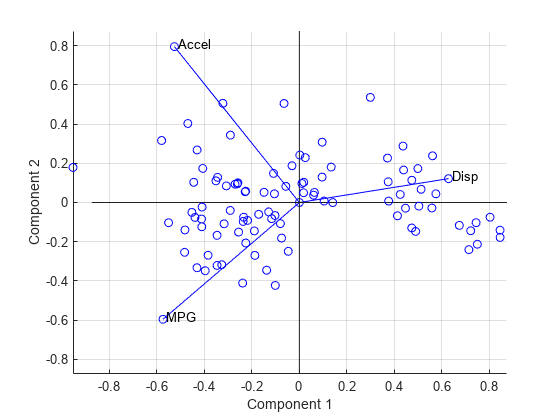
Label the three variables for easy identification. Specify circles as the marker symbol and blue as the line color for all line objects.

vbls = {'Accel','Disp','MPG'}; % Array of variable labels
h1 = biplot(coefs(:,1:2),'Scores',score(:,1:2),...
    'Color','b','Marker','o','VarLabels',vbls);

Figure contains an axes object. The axes object with xlabel Component 1, ylabel Component 2 contains 104 objects of type line, text.

h1 is a vector of handles to graphics objects. View the first few elements of h1.

h1(1:10) % First ten object handles
ans = 
  10x1 graphics array:

  Line    (varline)
  Line    (varline)
  Line    (varline)
  Line    (varmarker)
  Line    (varmarker)
  Line    (varmarker)
  Text    (varlabel)
  Text    (varlabel)
  Text    (varlabel)
  Line    (obsmarker)

The handles for the variable labels (h1(7:9)) are text. Therefore, the settings specified for the line properties do not affect these labels.

Create another biplot of the observations in the space of the first two principal components, and label the three variables for easy identification.

h2 = biplot(coefs(:,1:2),'Scores',score(:,1:2),'VarLabels',vbls);

Figure contains an axes object. The axes object with xlabel Component 1, ylabel Component 2 contains 104 objects of type line, text.

h2 is a vector of handles to graphics objects. View the first few elements of h2.

h2(1:10) % First ten object handles
ans = 
  10x1 graphics array:

  Line    (varline)
  Line    (varline)
  Line    (varline)
  Line    (varmarker)
  Line    (varmarker)
  Line    (varmarker)
  Text    (varlabel)
  Text    (varlabel)
  Text    (varlabel)
  Line    (obsmarker)

h2 contains 104 object handles.

  • The first three handles (h(1:3)) correspond to line handles for the three variables.

  • Handles h(4:6) correspond to marker handles for the three variables.

  • Handles h(7:9) correspond to text handles for the three variables.

  • The next 94 handles correspond to line handles for the observations.

  • The last handle corresponds to a line handle for the axis lines.

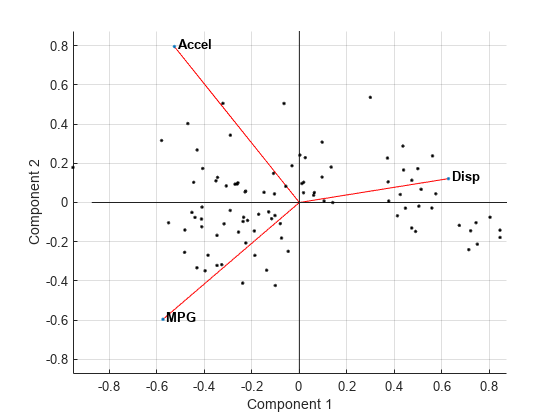
Modify specific properties of the biplot by using handles to the graphics objects.

Change the line color of the variables (vectors).

for k = 1:3
    h2(k).Color = 'r'; % Specify red as the line color
end

Modify the font of the variable labels.

for k = 7:9
    h2(k).FontWeight = 'bold';  % Specify bold font
end

Change the color of the observation markers.

for k = 10:103
    h2(k).MarkerEdgeColor = 'k';  % Specify black color for the observations
end

Figure contains an axes object. The axes object with xlabel Component 1, ylabel Component 2 contains 104 objects of type line, text.

Input Arguments

collapse all

Coefficients, specified as a matrix that has two or three columns. If coefs has two columns, then the biplot is 2-D; if coefs has three columns, then the biplot is 3-D. The columns of coefs usually contain principal component coefficients created with pca or pcacov, or factor loadings estimated with factoran. The axes in the biplot represent columns of coefs, and the vectors in the biplot represent rows of coefs (the observed variables).

Data Types: single | double

Axes for the plot, specified as an Axes object. If you do not specify ax, then biplot creates the plot using the current axes. For more information on creating an Axes object, see axes.

Name-Value Arguments

Specify optional pairs of arguments as Name1=Value1,...,NameN=ValueN, where Name is the argument name and Value is the corresponding value. Name-value arguments must appear after other arguments, but the order of the pairs does not matter.

Before R2021a, use commas to separate each name and value, and enclose Name in quotes.

Example: biplot(coefs,'VarLabels',varlabels) labels each vector (variable) with the text in the array varlabels.

Scores, specified as the comma-separated pair consisting of 'Scores' and a matrix with the same number of columns as coefs. Scores usually contains principal component scores created with pca or factor scores estimated with factoran. The biplot function represents each row of Scores (the observations) as points and each row of coefs (the observed variables) as vectors.

Example: 'Scores',score(:,1:3)

Data Types: single | double

Variable labels, specified as the comma-separated pair consisting of 'VarLabels' and a character array, string array, or cell array. biplot labels each vector (observed variable) with the text in the array.

Example: 'VarLabels',varlabels

Data Types: char | string | cell

Observation labels, specified as the comma-separated pair consisting of 'ObsLabels' and a character array, string array, or cell array. biplot uses the text in the array as observation names when displaying data cursors.

Example: 'ObsLabels',obslabels

Data Types: char | string | cell

Indicator for plotting in the positive coordinates, specified as the comma-separated pair consisting of 'Positive' and one of these logical values.

ValueDescription
false

Creates the biplot over the range +/– max(coefs(:)) for all coordinates (default)

true

Restricts the biplot to the positive quadrant (in 2-D) or octant (in 3-D)

Example: 'Positive',true

Data Types: logical

Property name, specified as the comma-separated pair consisting of a property name and its associated value for one or more supported Line Properties. These properties are the names and values for all primitive line graphics objects created by biplot. The specified property names control the appearance and behavior of the graphics objects.

Example: 'Marker','square','MarkerSize',10

Output Arguments

collapse all

Handles to the graphics objects created by biplot, returned as a column vector. The vector contains handles in this order:

  1. Handles corresponding to variables (line handles first, followed by marker handles then text handles)

  2. Handles corresponding to observations (marker handles first, followed by text handles)

  3. Handles corresponding to the axis lines

You can use the handles to query and modify properties of specific graphics objects. See Graphics Object Handles and Graphics Arrays for more details.

Tips

  • When working with large data sets or those involving many variables, you can achieve faster performance by calling biplot without assigning a graphics handle. In this case, access individual handles using their tags. For example:

    gca().Children
    ans = 
      5×1 Line array:
    
      Text    (varlabel)
      Line    (obsmarker)     
      Line    (axisline)      
      Line    (varmarker)     
      Line    (varline)   
    h = findobj(gca,"Tag","axisline")
    h = 
    
      Line (axisline) with properties:
    
                  Color: [0 0 0]
              LineStyle: '-'
              LineWidth: 1
                 Marker: 'none'
             MarkerSize: 1
        MarkerFaceColor: 'none'
                  XData: [-0.9395 0.9395 NaN 0 0]
                  YData: [0 0 NaN -0.9395 0.9395]
                  ZData: [1×0 double]
    
      Show all properties
    Set a new axis line style.
    h.LineStyle = ":";

Algorithms

A biplot allows you to visualize the magnitude and sign of each variable's contribution to the first two or three principal components, and to represent each observation in terms of those components. The biplot function:

  • Imposes a sign convention, forcing the element with the largest magnitude in each column of coefs to be positive. This action flips some of the vectors in coefs to the opposite direction, but often makes the plot easier to read. Interpretation of the plot is unaffected, because changing the sign of a coefficient vector does not change its meaning.

  • Scales the scores so that they fit on the plot. That is, the function divides each score by the maximum absolute value of all scores, and multiplies by the maximum coefficient length of coefs. Then biplot changes the sign of the score coordinates according to the sign convention for the coefficients.

Version History

Introduced before R2006a
Go to top of page