Graphics Arrays
Manage multiple graphics objects by storing them in a graphics array. This approach simplifies property changes, especially if you want to make changes to several objects at once. You can either get graphics arrays from plotting functions or create your own collections of graphics objects. When you use a graphics array, you can use array indexing to access the objects stored in them, vectorize certain tasks, and preallocate the arrays for better performance.
Access Arrays Created by Plotting Functions
If you plot multiple objects together, the plotting function returns a graphics array containing the objects it created. For example, plot three lines using the plot function, and specify an output argument to return the Line objects. Then add a legend.
y = [10 0 7; 0 10 7; 10 0 7];
p = plot(y,LineWidth=3);
legend(["Line 1", "Line 2", "Line 3"])
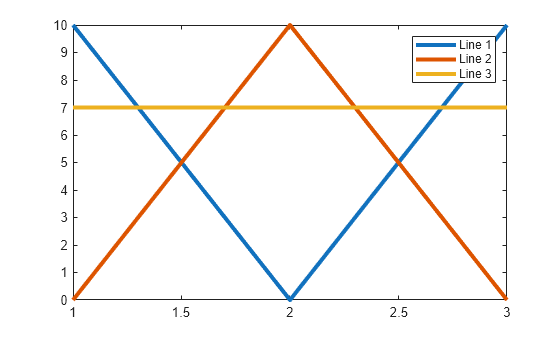
Display the elements of p, which is a column vector of Line objects. To access one of the elements of p, use array indexing in the same way you would index into any column vector. The index values start with 1 at the top and increase for elements further down the column.
p
p =
  3×1 Line array:

  Line    (Line 1)
  Line    (Line 2)
  Line    (Line 3)
Change the color of Line 2 to magenta.
p(2).Color = "magenta";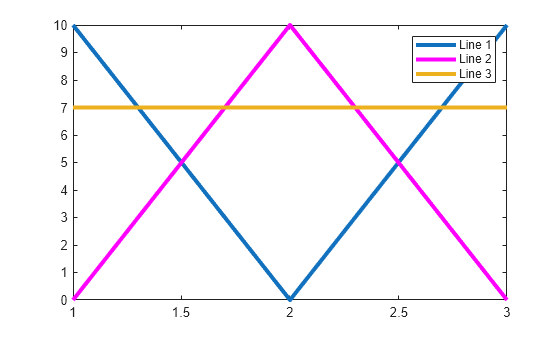
Figure, Axes, and TiledChartLayout objects each have a Children property that stores their child objects in a graphics array. You can use this property to access objects that are not explicitly stored as variables.
For example, to access the Line objects in a plot, use the Children property of the Axes object. Unlike the column vector returned by the plot function, the children of Axes objects are listed according to the stacking order in the plot. The object at the top of the stack is the first element in the column vector stored in the Children property.
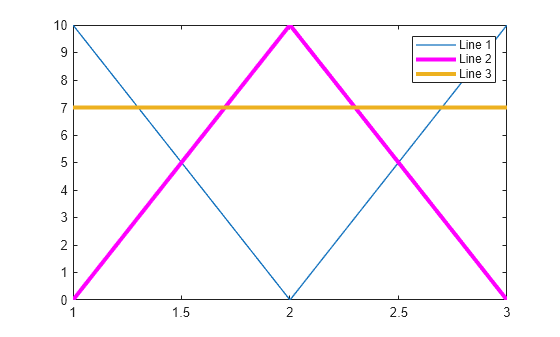
In the preceding plot, Line 1 is at the bottom of the stack (behind the other lines in the plot). Use the gca function to get the current axes. Then display the Children property of the Axes object. Because Line 1 is the third element in the vector, it has an index value of 3.
ax = gca;
ax.Children
ans =
  3×1 Line array:

  Line    (Line 3)
  Line    (Line 2)
  Line    (Line 1)
Reduce the thickness of Line 1.
ax.Children(3).LineWidth = 1;
In some cases, the index value of a child object might not be obvious. You can query property values to find your target object. For example, create four plots in a tiled chart layout.
figure
t = tiledlayout;
for k = 1:4
    nexttile
    plot(1:k*10)
end
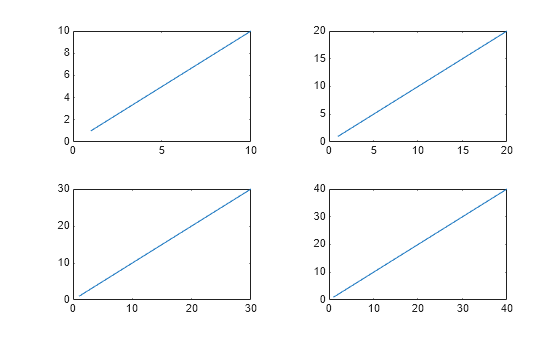
The TiledChartLayout object has four Axes objects in its Children property, but the list does not indicate which Axes object corresponds to each plot.
t.Children
ans =
  4×1 Axes array:

  Axes
  Axes
  Axes
  Axes
Because each Axes object has different x-axis limits, you can query the XLim property to identify them. The results are listed in the same order as the elements of the Children property. (Alternatively, you can use the nexttile function to locate an Axes object within a tiled chart layout.)
t.Children.XLim
ans = 1×2

     0    40
ans = 1×2

     0    30
ans = 1×2

     0    20
ans = 1×2

     0    10
Create Graphics Arrays
You can create a graphics array by specifying the elements in square brackets, just as you would create a numeric array. For example, create six Axes objects in a tiled chart layout.
figure
tiledlayout
ax1 = nexttile;
ax2 = nexttile;
ax3 = nexttile;
ax4 = nexttile;
ax5 = nexttile;
ax6 = nexttile;
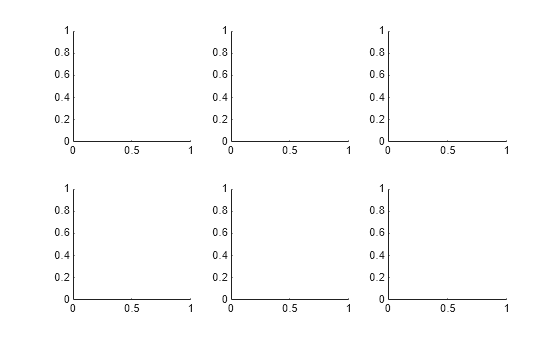
Store the Axes objects in a 1-by-6 graphics array garr. You can separate the elements in the array with spaces or commas. The resulting array garr has the data type Axes.
garr = [ax1 ax2 ax3 ax4 ax5 ax6]
garr =
  1×6 Axes array:

    Axes    Axes    Axes    Axes    Axes    Axes
Create a 2-D array by using a semicolon between rows. The rows and columns must have the same number of elements within their respective dimensions. For example, create a 2-by-3 array of Axes objects.
garr2 = [ax1 ax2 ax3; ax4 ax5 ax6]
garr2 =
  2×3 Axes array:

    Axes    Axes    Axes
    Axes    Axes    Axes
You can also create heterogeneous arrays that contain different types of graphics objects. For example, create the array hetarr containing the current figure (gcf) and ax1. The resulting array hetarr has the data type graphics.
hetarr = [gcf ax1]
hetarr =
  1×2 graphics array:

    Figure    Axes
Some functions accept graphics arrays as input, which enables you to make changes to several objects simultaneously. For example, display the grid in all the axes simultaneously by passing garr2 to the grid function.
grid(garr2,"on")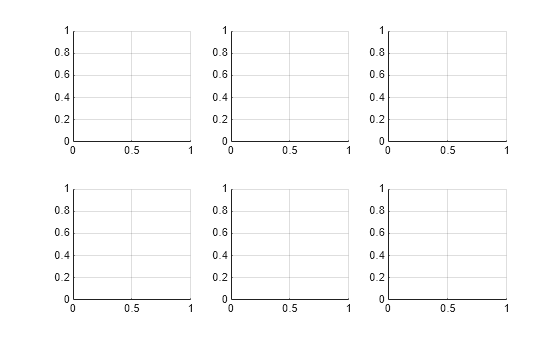
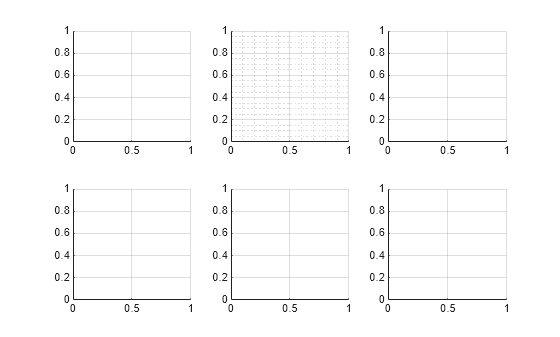
Display the minor grid in the second Axes object. Use array indexing and dot notation to access the XMinorGrid and YMinorGrid properties of the Axes object in the first row and second column of garr2.
garr2(1,2).XMinorGrid = "on";
garr2(1,2).YMinorGrid = "on";
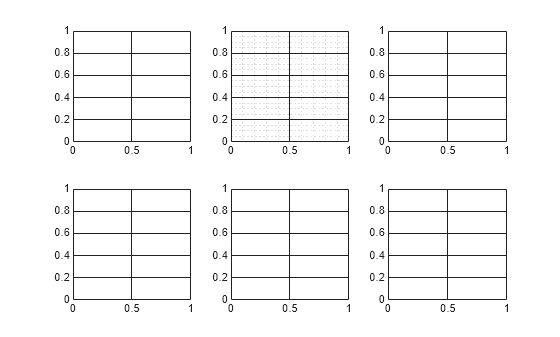
You can also vectorize set operations. For example, make all the major grid lines opaque by setting the GridAlpha property of each Axes object to 1.
set(garr2,GridAlpha=1)
Preallocate Graphics Arrays
To preallocate a graphics array, use the gobjects function. Then you can populate the elements of the array as you create graphics objects.
If you create objects in a loop, populating the elements of a preallocated array is more performant than appending new elements to the end of an originally empty array.
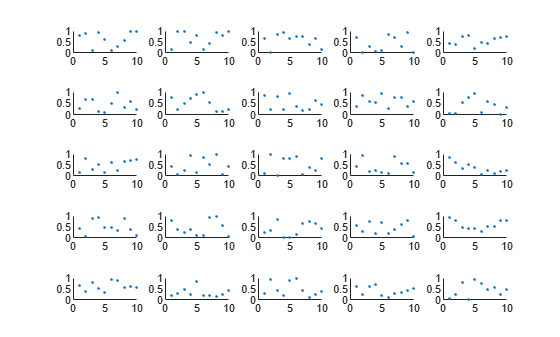
For example, preallocate a 5-by-5 graphics array ax. Write a for-loop that creates 25 Axes objects in a tiled chart layout by calling the nexttile function and returning the Axes objects to specific locations in ax. Then plot some random data.
figure
ax = gobjects(5,5);
t = tiledlayout(5,5,TileSpacing="compact");
for i = 1:25
   ax(i) = nexttile;
   scatter(1:10,rand(1,10),".")
   ylim([0 1])
end
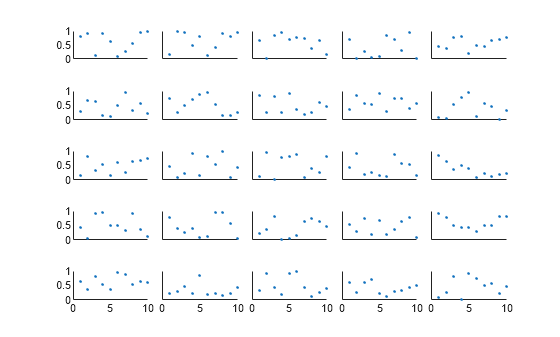
Remove the tick labels from all the Axes objects except the ones in the left column and bottom row.
xticklabels(ax(1:20),[])
idx = [2:5; 7:10; 12:15; 17:20; 22:25];
yticklabels(ax(idx),[])
See Also
Functions
tiledlayout|nexttile|gobjects|grid|xticklabels|yticklabels