Log and View Data with the Stateflow API
This example shows how to log and view logged data from the command line.
Use the Stateflow application programming interface (API) to programmatically log and analyze chart data during simulation. With the API, you can create scripts to log data. With the logged data, you can display results in MATLAB, and export the data to external formats. For more information, see Overview of the Stateflow API.
Enable Signal Logging
To enable logging for a state or data object, get a handle to the object and set its LoggingInfo.DataLogging property to true. Enable logging for the state ReelMoving and output data Stateflow.Data in the model sf_yoyo.
1. Load the model.
load_system("sf_yoyo");2. Access the Stateflow.State object that corresponds to the state ReelMoving.
reelMoving = find(sfroot,"-isa","Stateflow.State", ...
    Name="ReelMoving");
3. Access the Stateflow.Data object that corresponds to the output data ReelState.
reelState = find(sfroot,"-isa","Stateflow.Data", ...
    Name="ReelState");
4. Enable logging for the state and the output data.
reelMoving.LoggingInfo.DataLogging = true;
reelState.LoggingInfo.DataLogging = true;
5. Enable custom naming and change the logging name of the state ReelMoving to Reel Moving Log.
reelMoving.LoggingInfo.NameMode = "Custom";
reelMoving.LoggingInfo.LoggingName = "Reel Moving Log";
6. Run the simulation.
sim("sf_yoyo.slx");
Access Logged Data
To access the data logged during simulation, use the get function on the logsout variable.
reelMovingLog = get(logsout,"Reel Moving Log")reelMovingLog =
Stateflow.SimulationData.State
Package: Stateflow.SimulationData
Properties:
Name: 'Reel Moving Log'
BlockPath: [1×1 Simulink.SimulationData.BlockPath]
Values: [1×1 timeseries]
Methods, Superclasses
reelStateLog = get(logsout,"ReelState")reelStateLog =
Stateflow.SimulationData.Data
Package: Stateflow.SimulationData
Properties:
Name: 'ReelState'
BlockPath: [1×1 Simulink.SimulationData.BlockPath]
Values: [1×1 timeseries]
Methods, Superclasses
To access the logged data and time of each logged element in a table, use the Values.Data and Values.Time properties.
T1 = table(reelMovingLog.Values.Time,reelMovingLog.Values.Data);
T1.Properties.VariableNames = ["Time","Data"]
T1=121×2 table
     Time     Data
    ______    ____

         0     0
     5.025     1
     5.275     0
     10.16     1
     10.66     0
     15.03     1
     15.53     0
    20.124     1
    20.624     0
    24.992     1
    25.492     0
    30.084     1
    30.584     0
    34.951     1
    35.451     0
    40.041     1
      ⋮
T2 = table(reelStateLog.Values.Time,reelStateLog.Values.Data);
T2.Properties.VariableNames = ["Time","Data"]
T2=122×2 table
       Time       Data
    __________    ____

             0      0
    3.1554e-30      0
         5.025      1
         5.275      0
         10.16     -1
         10.66      0
         15.03      1
         15.53      0
        20.124     -1
        20.624      0
        24.992      1
        25.492      0
        30.084     -1
        30.584      0
        34.951      1
        35.451      0
      ⋮
View the logged data in a figure window by using the plot function.
X = reelStateLog.Values.Time;
Y = reelStateLog.Values.Data;

plot(X,Y,"-o")
xlabel("Time")
ylabel("Data")
set(gcf,"position",[100,100,1000,400])
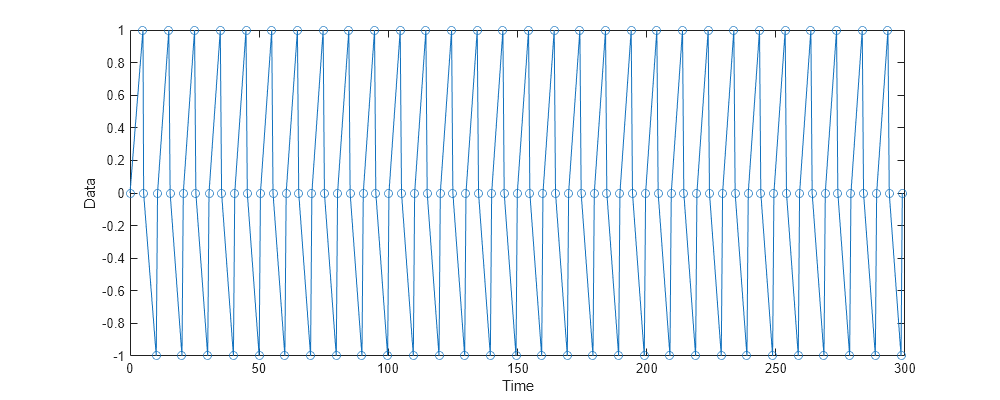
The signal logging object records a data point every time that the Stateflow chart writes to the data, even if the data does not change value. For example, in the table T2, the first two entries contain a value of 0. These entries correspond to when the chart initializes the output data ReelState at time 0 and when a default transition sets ReelState at time 3.1554e-30.
See Also
Objects
Simulink.SimulationData.Dataset(Simulink) |Stateflow.SimulationData.Data|Stateflow.SimulationData.State
Functions
Tools
- Simulation Data Inspector (Simulink) | Signal Properties (Simulink)