Main Content

Stateflow Programmatic Interface

Create and modify chart elements at the MATLAB® command prompt

Programmatically create and edit Stateflow® charts. Add new objects to your chart, access and edit properties, set positions, copy and paste objects, and change the magnification level of the Stateflow Editor.

Functions

expand all

sfnewCreate Simulink model that contains an empty Stateflow block
sfrootRoot of Stateflow hierarchy
sfclipboardClipboard object
sfgcoSelected objects in chart
Stateflow.findMatchingPortIdentify matching entry or exit port (Since R2021b)

Objects

expand all

Chart, Block, and Machine Objects

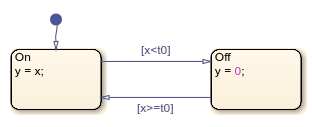
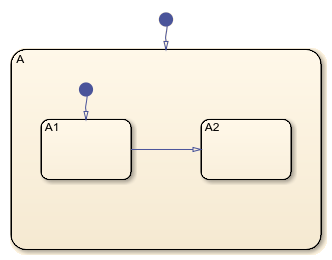
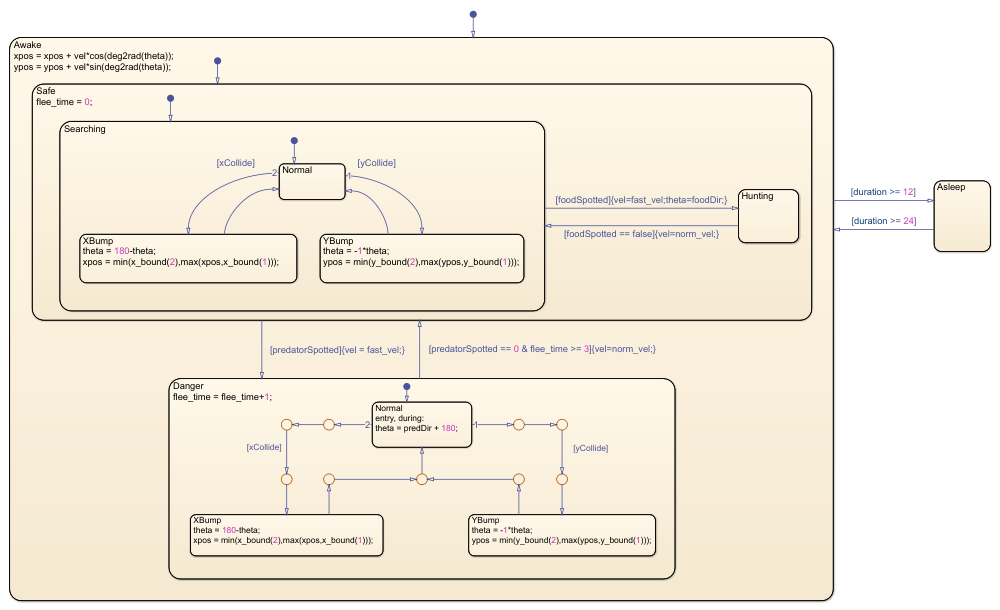
Stateflow.ChartGraphical representation of a finite state machine
Stateflow.StateTransitionTableChartTabular representation of state machine for modal logic
Stateflow.TruthTableChartTabular representation of state machine for decision logic
Stateflow.EMChartStateflow interface to MATLAB Function block
Stateflow.MachineContainer for Stateflow blocks in a Simulink model

Graphical Objects

Stateflow.AnnotationAnnotation in chart, state, box, or function
Stateflow.AtomicBoxAtomic box in chart, state, box, or function
Stateflow.AtomicSubchartAtomic subchart in chart, state, or box
Stateflow.BoxBox in chart, state, box, or function
Stateflow.EMFunctionMATLAB function in chart, state, box, or function
Stateflow.FunctionGraphical function in chart, state, box, or function
Stateflow.JunctionConnective or history junction in chart, state, box, or function
Stateflow.PortEntry or exit port in state or atomic subchart (Since R2021b)
Stateflow.SimulinkBasedStateSimulink based state in chart, state, or box
Stateflow.SLFunctionSimulink function in chart, state, box, or function
Stateflow.StateState in chart, state, or box
Stateflow.TransitionTransition in chart, state, box, or function
Stateflow.TruthTableTruth table function in chart, state, box, or function

Nongraphical Objects

Stateflow.DataData in chart, state, box, or function
Stateflow.EventEvent in chart, state, or box
Stateflow.MessageMessage in chart, state, or box

Clipboard and Editor Objects

Stateflow.ClipboardClipboard to copy and paste Stateflow objects
Stateflow.EditorGraphical aspects of a chart or state transition table

Object Functions

expand all

Navigate Hierarchy

findIdentify specified objects in hierarchy
getChildrenIdentify children of object
getParentIdentify parent of object
getReferencesIdentify references to symbol name
commentedByIdentify objects that implicitly comment out a graphical object
defaultTransitionsIdentify default transitions in specified object
innerTransitionsIdentify inner transitions with specified source
outerTransitionsIdentify outgoing transitions with specified source
sinkedTransitionsIdentify transitions with specified destination
sourcedTransitionsIdentify transitions with specified source

Access and Modify Properties

dialogOpen properties dialog box
exportAsStructExport contents of state transition table as structure array
renameReferencesRename symbol and update references to symbol name
setImageInsert image into annotation

Control Display

viewDisplay object in editing environment
highlightHighlight graphical object
fitToViewZoom in on graphical object
zoomInZoom in on Stateflow chart
zoomOutZoom out on Stateflow chart

Map Symbols in Atomic Subcharts and Simulink Based States

getMappingForSymbolGet mapping for symbol in atomic subchart, atomic box, or Simulink based state
setMappingForSymbolSet mapping for symbol in atomic subchart, atomic box, or Simulink based state
clearMappingForSymbolClear mapping for symbol in atomic subchart, atomic box, or Simulink based state
disableMappingForSymbolDisable input event in atomic subchart or box

Copy and Paste Objects

copyCopy array of objects to clipboard
pasteToPaste objects in clipboard to specified container object

Convert Charts and State Transition Tables

convertToChartConvert state transition table to Stateflow chart
convertToSTTConvert Stateflow chart to state transition table

Topics