Compare Simulation to Baseline Data
In this example, you use the Simulink Test Manager to add signal tolerances to baseline data. You make changes to the model and run the test to simulate the model. Then, you review the results to compare the simulation output to baseline data.
Open the Test File and Model
To open the model sldemo_absbrake and capture baseline data in the test file baselineTestFile.mldatx, follow the steps in Author a Baseline Test Case. Otherwise:
1. Open the model.
open_system("sldemo_absbrake");2. Load the test file and open the Test Manager.
sltest.testmanager.load("baselineTestFile.mldatx");
sltest.testmanager.view
Add Signal Tolerances and Update Model
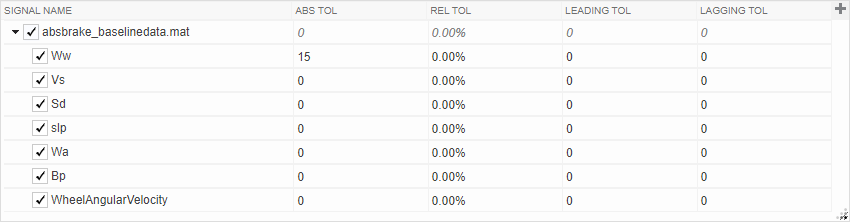
1. In the Test Manager, in the left pane, select Test Browser, then select the baselineTestCase test case. In the right pane, expand the Baseline Criteria section. Set the absolute tolerance of the Ww signal by setting the value in the Abs Tol column to 15. For more information, see Set Signal Tolerances.
2. In the sldemo_absbrake model, set the Desired relative slip Constant block to 0.22.
Run the Test and Review Results
1. In the Test Manager, select baselineTestCase and click Run.
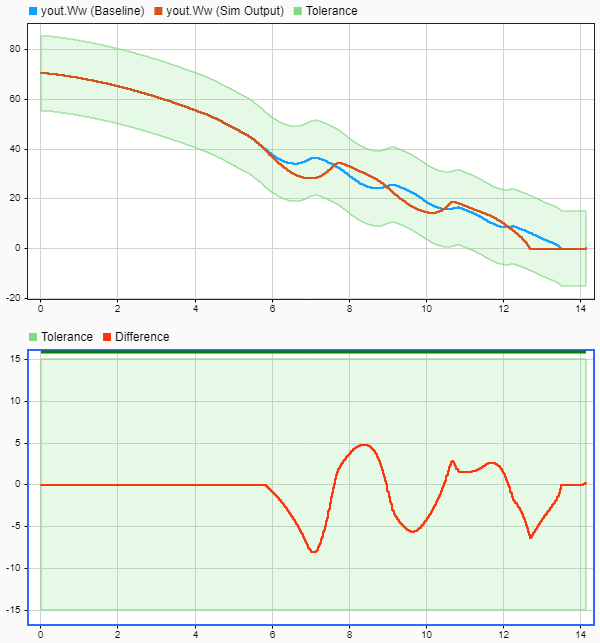
2. In the Results and Artifacts pane, for the most recent results, expand baselineTestCase and double-click Baseline Criteria Result. Then, in the Data Inspector, in the Compare pane, select the Ww signal. The upper plot displays the simulation output data, baseline data, and tolerance. The lower plot displays the tolerance and the difference between the simulation output and the baseline data. The Ww signal passes the test, because the signal is stays within the specified tolerance when compared to the baseline data.
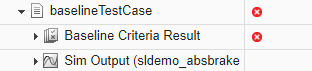
3. The overall test fails because the other signal comparisons do not satisfy the tolerance values specified in the Baseline Criteria section of the test case. In the Results and Artifacts pane, the test case displays a failed status.
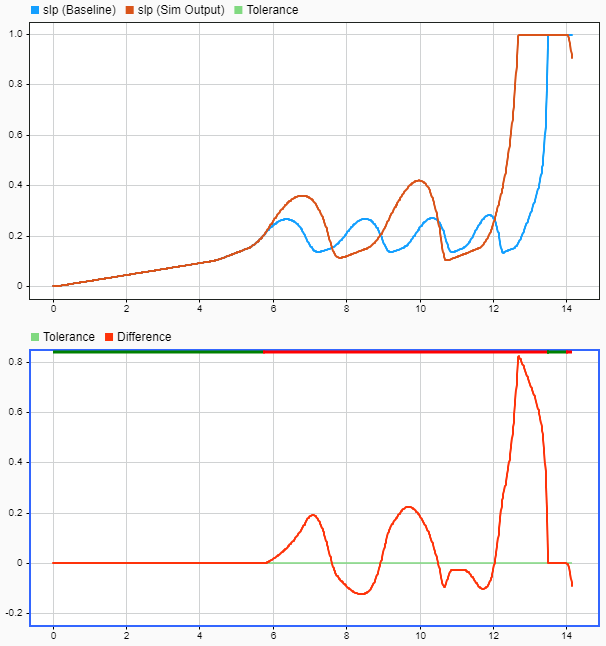
In the Compare pane of the Data Inspector tab, in the Baseline Criteria Result section, select the slp signal. The upper plot shows that the simulation output and baseline data are not the same. The lower plot displays a difference greater than the zero difference required to satisfy the baseline criteria.