Main Content

report

Generate profiler report

Since R2020b

Description

example

report(profiler_object) generates a report from the profiler data.

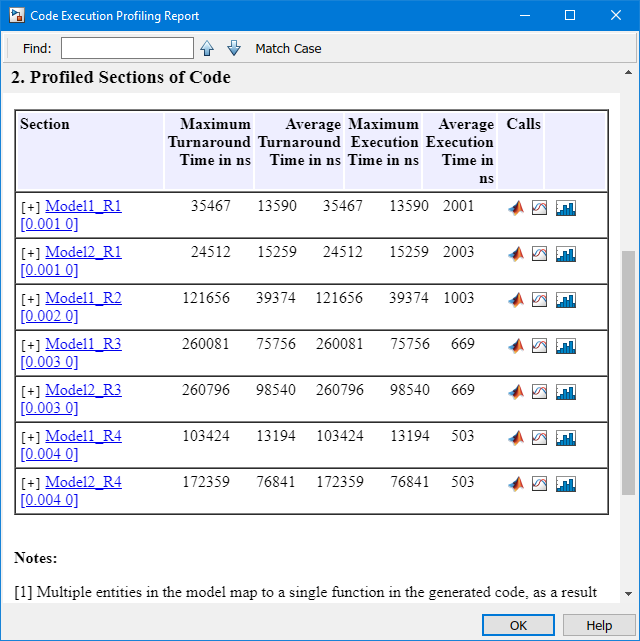
The Code Execution Profiling Report displays model execution profile results for each task.

  • To display the profile data for a section of the model, click the membrane button  next to the section.

  • To display the TET data for the section in the Simulation Data Inspector, click the plot time series data button .

  • To view the section in Simulink® Editor, click the link next to the expand tree button .

  • To view the lines of generated code corresponding to the section, click the expand tree button , and then click the view source button .

Examples

collapse all

The real-time application is already loaded. Start the profiler. Start the application.

  1. tg = slrealtime('TargetPC1');
    startProfiler(tg);
    start(tg);
    
  2. Stop the profiler. Stop the application.

    stopProfiler(tg);
    stop(tg);
  3. Retrieves profiler data.

    profiler_object = getProfilerData(tg);
    Processing data, please wait ...
  4. Call the report function on the results data.

    report(profiler_object);

    The code execution profiling report for the model profiles execution of each section of code.

Input Arguments

collapse all

MATLAB® variable that you can use to access the result of the profiler execution. You display the profiler data by calling the plot and report functions.

The structure has these fields:

  • TargetName — Name of target computer in target computer settings.

  • ModelInfo — Information about model on which profiler ran:

    • ModelName — Name of real-time application.

    • MATLABRelease — MATLAB release under which model was built.

You can access the data in the profiler_object variable. To access the profiler data, before running the profiler, open the Configuration Parameters dialog box. In the Real-Time tab, click Hardware Settings. Select the Code Generation > Verification > Workspace variable option and set the value to executionProfile. Select the Save options option and set the value to All data. After running the profiler, use the technique described for the Sections (Embedded Coder) function.

Version History

Introduced in R2020b