Highlight Active Time Intervals by Using Activity-Based Time Slicing
Stateflow® states and transitions can be active, inactive, or sleeping during model simulation. You can use Model Slicer to constrain model highlighting to only highlight the time intervals in which certain Stateflow Represent Operating Modes by Using States (Stateflow) and Transition Between Operating Modes (Stateflow) are active. Therefore, you are able to refine your area of interest to only those portions of your model that affect model simulation during the operation of the selected states and transitions. You can also constrain model highlighting to the intersection of the time intervals of two or more states or transitions.
Highlighting the Active Time Intervals of a Stateflow State or Transition
The slslicer_fuelsys_activity_slicing model contains a fault-tolerant fuel control system. In this tutorial, you use activity-based time slicing to refine a model highlight to only those time intervals in which certain states and transitions are active. You must be familiar with how to Highlight Functional Dependencies by using Model Slicer.
Create a Dynamic Slice Highlight for an Area of Interest
1. Open the slslicer_fuelsys_activity_slicing model.
open_system('slslicer_fuelsys_activity_slicing');2. Open Model Slicer and add the control logic Stateflow® chart in the fuel rate controller subsystem as a Model Slicer starting point.
3. Highlight the portions of the model that are upstream of the control logic Stateflow chart.
4. Simulate the model within a restricted simulation time window (maximum 20 seconds) to highlight only the areas of the model upstream of the starting point and active during the time window of interest.

Constrain the Model Highlight to the Active Time Interval of a Stateflow State
1. On the Apps tab, under Model Verification, Validation, and Test gallery, click Model Slicer.
2. Navigate to the control logic Stateflow chart in the fuel rate controller subsystem.
open_system('slslicer_fuelsys_activity_slicing/fuel rate controller/control logic');3. To constrain the model highlight to only those time intervals in which the Fueling_Mode > Running > Low_Emissions > Warmup state is active, right-click the Warmup state and select Model Slicer > Constrain to active time intervals for Warmup.

Model Slicer is updated to highlight only those portions of the model that are active during the time intervals in which the Warmup state is active.
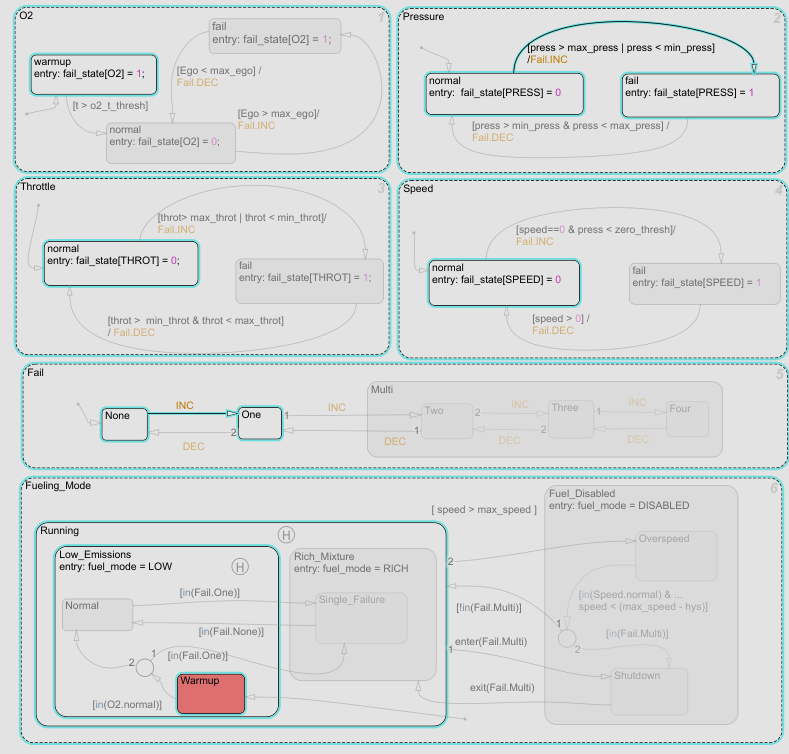
The Model Slicer is also updated to show the time interval in which the Warmup state is active:
Actual simulation time: 0.01 to 3.86 seconds : 1 active interval.
The highlight shows a normal to fail transition in the Pressure state, showing that a pressure failure occurred during the time interval in which the Warmup state was active.
Constrain the Model Highlight to the Intersection of the Active Time Intervals of a Stateflow State and Transition
1. Clear any time interval constraints from the Model Slicer.
2. Constrain the model highlight to only those time intervals in which the O2 > fail state is active.
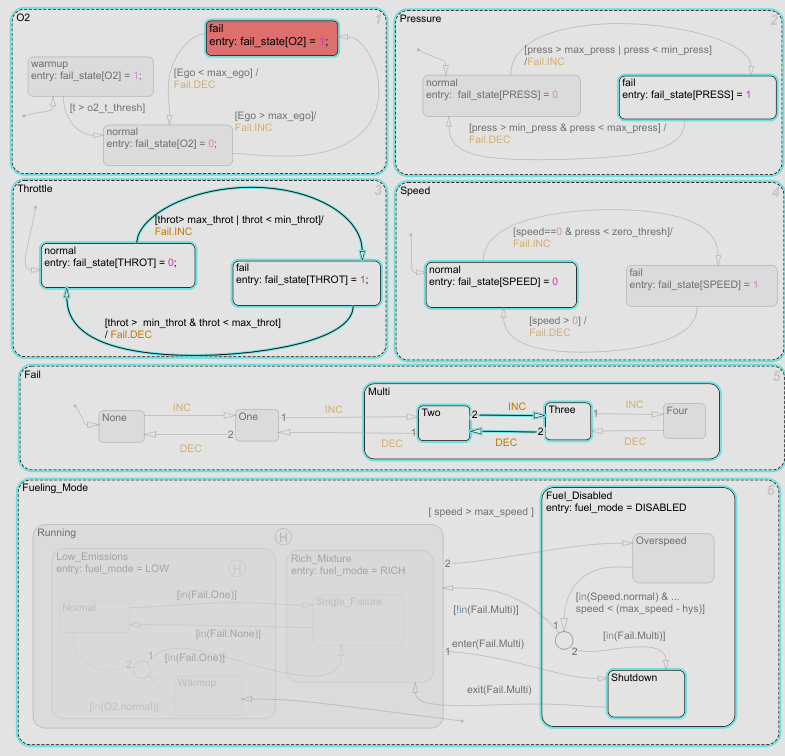
Model Slicer is updated to highlight only those portions of the model that are active during the time intervals in which the O2 > fail state is active. The Model Slicer is also updated to show the time interval in which the O2 > fail state is active:
Actual simulation time: 4.83 to 20 seconds : 1 active interval
3. To constrain the highlighting to the time interval in which the O2 > fail state is active and the normal to fail transition occurs for the Throttle chart, right-click the normal to fail transition and add it as a constraint. Model Slicer is updated to highlight only those portions of the model that are active during the intersection of the time intervals in which the O2 > fail state is active and the normal to fail transition occurs for the Throttle chart.

The Model Slicer is also updated to show the time interval in which the O2 > fail state is active and the normal to fail transition occurs for the Throttle chart:
Actual simulation time: 13.87 to 13.87 seconds : 1 active interval
Activity-Based Time Slicing Limitations and Considerations
For limitations and considerations of activity-based time slicing, see Model Slicer Considerations and Limitations.
Stateflow State and Transition Activity
For more information on Stateflow state and transition activity, see Chart Simulation Semantics (Stateflow), Types of Chart Execution (Stateflow), and Syntax for States and Transitions (Stateflow).