Trigger a Discrete-Event Chart Block on Message Arrival
This example shows how to trigger a Discrete-Event Chart Block on the message arrival when generating parts in a facility and performing quality assurance. In the example, behaviors of a Discrete-Event Chart and Stateflow® Chart blocks are compared. Both blocks require a Stateflow® license. The example shows that, a Discrete-Event Chart block executes immediately upon the arrival of a message and does not wait for the next sample time hit.
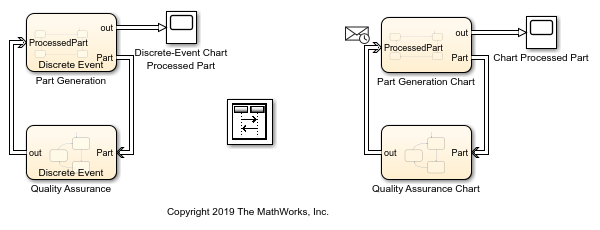
In this example, a part is generated in the Part Generation block and it is sent to the Quality Assurance block for the Part's quality control. After the evaluation, the Quality Assurance block outputs the validated part.
The model is further modified to send the validated part back to the Part Generation block from which it is shipped to the customer. For both models in this example, the solver is set to Fixed-step with step size 1, and for all the Stateflow® Chart blocks, the Enable Super Step Semantics option is selected. For more information, see Super Step Semantics (Stateflow).

Model Description
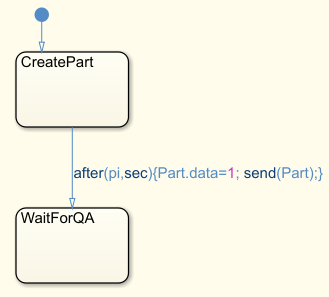
In the PartQualityEvaluationModel model, the Part Generation is modeled by a Discrete-Event Chart block, and the Part Generation Chart is modeled by a Stateflow® Chart block. Both blocks contain the same state transition logic including two states, CreatePart and WaitForQA.
The
CreatePartstate represents the production of aPartinpiseconds.
The
WaitForQAstate represents the wait for the quality control department for thePart's validation.
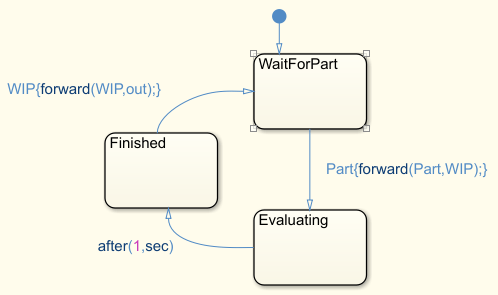
Similarly, Quality Assurance is modeled by a Discrete-Event Chart block and Quality Assurance Chart is modeled by using a Stateflow® Chart block. Both blocks contain the same state transition logic including three states, WaitForPart, Evaluating, and Finished.
The
WaitForPartstate represents the wait for the generated Part.
When the Part arrives, the block transitions to the
Evaluatingstate to represent the start of the evaluation process.
After
1second, the evaluation is complete and the block transitions toFinishedstate.
The Part departs the block and the block transitions back to the
WaitForPartstate.
Simulation Results
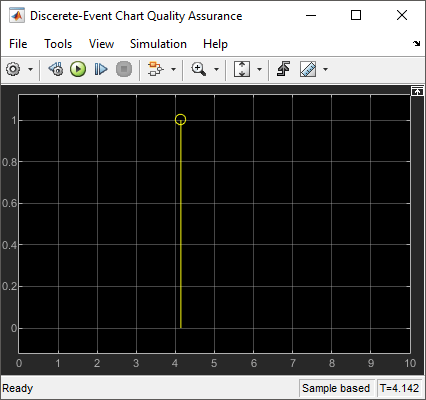
Simulate the model. Observe the Scope block connected to the Quality Assurance block. The block outputs the Part after 4.14 seconds, which is the sum of 3.14 seconds required for the Part's generation and 1 s for its quality control.
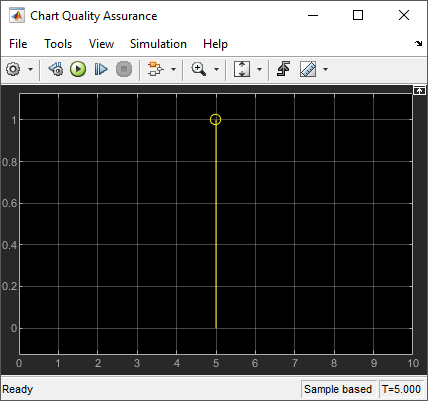
Observe the Scope block that is connected to the Quality Assurance Chart block. The block outputs the Part after 5 seconds, which is the sum of 4 seconds for the Part's generation and 1 second for its quality control as a result of fixed step size 1. This difference is based on the precise timing property of the Discrete-Event chart. For more information, see Discrete-Event Chart Precise Timing.
Further Modify the Model
Open PartQualityControlShip.slx which is the modified the model that sends the processed Part back to the Part Generation block for shipment. In the PartQualityControlShip model, the modified Part Generation and Part Generation Chart blocks contain the same set of additional states and transitions.
In the Part Generation and Part Generation Chart Blocks:
The
Reviewstate represents the review of the quality control report for theProcessedPart. When theProcessedPartreturns, the block transitions to theReviewstate.
When the review is complete after
sqrt(2)seconds, the block transitions to theShipstate.
When the processed Part is shipped to the customer, the block transitions back to the
CreatePartstate to generate a new part.

Simulation Results
Simulate the modified model. Observe that the processed Part departs the Part Generation block after 5.55 seconds, which is the sum of 4.14 required for part generation and quality control and 1.41 for the review before shipment.

Observe that the processed Part departs the Part Generation Chart after 8 seconds, which is the sum of 5 required for part generation and quality control, 2 for the review before shipment, and 1 for the block's static scheduling.

Observe the Sequence Viewer block. Each time grid row bordered by two blue lines contains events that occur at the same simulation time. The Sequence Viewer window shows events vertically, ordered in time, and uses a combination of linear and nonlinear displays. For more information, see Use the Sequence Viewer to Visualize Messages, Events, and Entities.
The ProcessedPart is sent from Quality Assurance block to Part Generation at 4.1 and the Part's arrival triggers the Discrete-Event Chart block immediately. At time 5, the ProcessedPart is sent from the Quality Assurance Chart to the Part Generation Chart. However, the Part Generation Chart waits for the next sample time hit at 6 after the message arrival to execute.
In the order, Part Generation Chart executes first and Quality Assurance Chart executes second in one sample time hit. That is the reason why Part Generation Chart block waits for the next sample time hit to execute as the first block in the order.
