Data Sets for Signal Processing
Use these data sets with MATLAB® and Signal Processing Toolbox™ to get started with signal processing applications.
Audio and Acoustics Data Sets
| Data Set | Data Set Information |
|---|---|
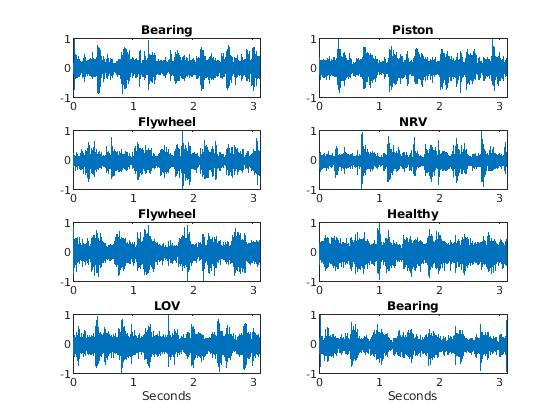
Air Compressor
| This data set comprises 1800 acoustic recordings collected on a single-stage reciprocating-type air compressor [1]. The data is collected at a sample rate of 16 kHz for 3.125 seconds. The data set contains single-channel signals in eight subfolders that correspond to one of these operational states:
To learn more about this data set, expand these sections. |
Phonocardiogram (PCG) Data — PhysioNet Challenge 2016
| This data set comprises 3,829 acoustic recordings of heart sounds from the PhysioNet Computing in Cardiology Challenge 2016 [2][3]. The data is collected at a sample rate of 2 kHz for 5 seconds. The data set supports binary classification of cardiac health status through automated phonocardiogram interpretation in resource-limited settings, remote cardiac health screening, and early detection of heart conditions.
Applications include automated cardiac screening systems, telemedicine and remote diagnostics, point-of-care cardiac assessment, medical training and education, and algorithm development for cardiac sound analysis. To learn more about this data set, expand these sections. |
Acoustic scenes — Detection and Classification of Acoustic Scenes (DCASE) 2013 Challenge
| This data set comprises 200 environmental audio recordings from the Detection and Classification of Acoustic Scenes and Events (DCASE) 2013 challenge [4][5]. Each recording is collected at a sample rate of 44.1 kHz for 30 seconds. The data set contains two-channel signals in two subfolders, comprising training data and test data.
To learn more about this data set, expand these sections. |
Free Spoken Digits
| This data set comprises 2000 voice recordings of spoken digits (0-9) by four individuals [6]. Each recording is collected at a sample rate of 8 kHz for a variable duration from 0.14 to 2.28 seconds. The data set contains 16-bit single-channel signals distributed in 200 recordings per spoken digit. The multiple speakers provide diversity in accents and vocal characteristics, supporting development of robust digit recognition systems that generalize across different voices. To learn more about this data set, expand these sections. |
Mozilla.org® Common Voice Speech Denoising
| This data set comprises 2800 speech recordings as a curated subset of Mozilla.org Common Voice open-source speech corpus [7]. Each recording is collected at a sample rate of 48 kHz for a variable duration from 2 to 10 seconds. The data consists of 16-bit single-channel signals distributed in three subfolders: training, validation, and test.
To learn more about this data set, expand these sections. |


Biomedical Data Sets
| Data Set | Data Set Information |
|---|---|
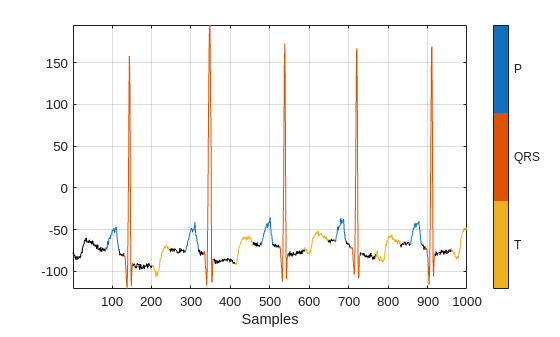
Electrocardiogram (ECG) Data — QT Wave
| This data set comprises 210 ECG recordings from 105 patients for automated waveform segmentation [2][8]. To obtain each recording, examiners placed two electrodes on different locations on a patient's chest and collected ECG waveforms at a sample rate of 250 Hz for approximately 15 minutes. The data set contains two-channel ECG signals and four labeled cardiac regions:
The segmentation of these regions can provide the basis for measurements useful for assessing the overall health of the human heart and the presence of abnormalities [9]. To learn more about this data set, expand these sections. |
Myoelectric (EMG) Data — Arm motion
| This data set comprises 720 EMG signal recordings measuring electrical muscle activity from 30 subjects performing various arm movements [10]. Each recording captured 3 seconds of motion at a sample rate of 3 kHz. The data set contains 720 files with eight-channel EMG signals and 720 label files.
To learn more about this data set, expand these sections. |
ECG Data — PhysioNet MIT-BIH
| This data set comprises 46,080 segments of ECG signals and noise specifically prepared for ECG signal denoising applications. The recording captured 43.5 hours of ECG data from 47 subjects at a sample rate of 300 Hz. Each segment has 1024 samples, covering approximately 3.4 seconds of data. The data set contains high-quality clinical-grade single-lead ECG recordings (typically MLII - Modified Lead II) from the PhysioNet MIT-BIH Arrhythmia database [2][11] and MIT-BIH Noise Stress Test database [2][12].
To learn more about this data set, expand these sections. |
Fetal ECG Data — Source Separation
| This data set comprises 600 fetal ECG synthetic signal recordings ([2], [13]), designed for separating fetal and maternal ECG components from mixed abdominal surface recordings for non-invasive fetal cardiac monitoring during pregnancy. Each recording captured between 10 and 30 seconds of abdominal electrocardiogram (aECG) data from 10 subjects at a sample rate of 1 kHz. Fetal signals are 3-10 times weaker than maternal signals, requiring sophisticated separation techniques to extract pure fetal ECG from mixed recordings captured by 4-8 abdominal electrode channels. The data set includes four SNR configurations to test model robustness:
The data set comprises 540 training recordings from nine synthetic pregnant patient profiles and 60 test recordings from one held-out subject.
To learn more about this data set, expand these sections. |
Electroencephalogram (EEG) and Electrooculogram (EOG) Data — Brain Activity
| This data set comprises 4,514 artifact-free EEG signal segments and 3,40 pure-artifact EOG signal segments, designed for removing eye movement artifacts from brain activity recordings [14]. Both types of segments are recordings that measure brain activity. Each recording captured for 2 seconds of data at a sample rate of 256 Hz. Eye movements create strong electrical artifacts that contaminate EEG signals, requiring removal while preserving genuine brain activity for clean EEG analysis in research and diagnostics. The data set contains clean (artifact-free) EEG signals and EOG artifact signals.
The data set supports multiple denoising approaches, including additive mixing (clean EEG + scaled EOG creates contaminated signal) and adaptive filtering (reference-based artifact removal). This support enables you to explore different signal processing methodologies for optimal artifact removal performance across various application scenarios. To learn more about this data set, expand these sections. |


Geoscience Data Sets
| Data Set | Data Set Information |
|---|---|
Stanford earthquake
| This data set comprises 20,000 seismic measurements from the Stanford Earthquake Dataset (STEAD) [15]. The data is collected at a sample rate of 100 Hz. The data set provides clean/noisy seismic signal pairs for development of diverse applications, including earthquake early warning systems, seismic signal denoising and enhancement, and automatic phase picking and wave detection.
To learn more about this data set, expand these sections. |

Noise, Vibration, and Harshness Data Sets
| Data Set | Data Set Information |
|---|---|
Colored Noise
| This data set comprises a synthetic collection of 750 random noise process realizations designed for evaluating classifiers on time-series signal data. Each signal has 2,000 samples. The data set provides 250 signals for each of three distinct noise types with unique spectral characteristics:
The normalized random processes provide controlled conditions for demonstrating signal classification workflows. To learn more about this data set, expand these sections. |

Radar and Wireless Data Sets
| Data Set | Data Set Information |
|---|---|
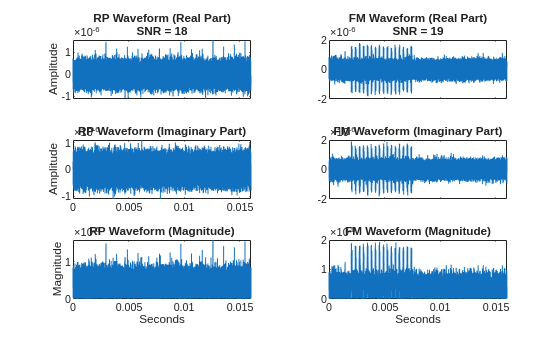
Rectangular Pulse and Linear Frequency Modulated (RPLFM) Simulated Radar
| This data set comprises 900 simulated radar waveforms in noise designed to model realistic spectrum-sharing scenarios in the Citizens Broadband Radio Service (CBRS) band at 3.5 GHz [16]. The data is collected at a sample rate of 10 MHz for 80 milliseconds. The data set contains two subfolders, comprising training data and test data.
To learn more about this data set, expand these sections. |
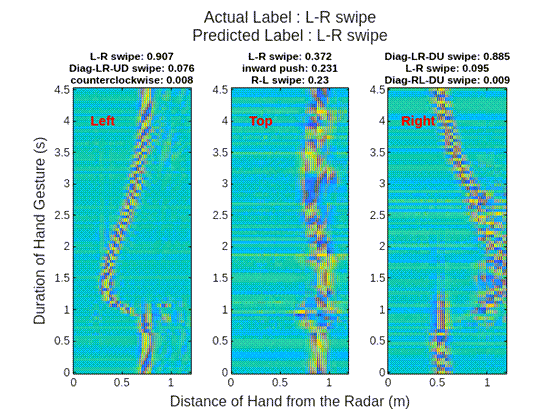
Ultra-Wideband Radar Sensed Gestures
| This data set comprises 9,600 radar-sensed 2-D recordings of 12 dynamic hand gestures [17], gathered from eight different human volunteers. To obtain each recording, the examiners placed a separate UWB impulse radar at the left, top, and right sides of their experimental setup, resulting in three received radar signal data matrices.
Movement-based signal data acquired using sensors, like UWB impulse radars, contain patterns specific to different gestures. Correlating motion data with movement benefits several avenues of work, including hand gesture recognition for contactless human-computer interaction. To learn more about this data set, expand these sections. |
Continuous-Wave (CW) Radar Health Monitoring
| This data set comprises 2,060 files (1,030 CW radar segments and 1,030 ECG segments) of non-contact vital signs gathered from six healthy adult subjects [18]. The data is collected at a downsampled sample rate of 200 Hz for 5.12 seconds per segment. The data set contains two subfolders, comprising training/validation data and test data.
The recordings were collected in controlled laboratory settings with subjects in seated or resting positions under normal respiration conditions.
The time-aligned radar and ECG data enable development of systems that map radar signals to cardiac metrics, supporting applications in remote patient monitoring, sleep apnea detection, elderly care, infant monitoring, smart home health monitoring, and vital signs monitoring in environments where contact sensors are impractical. To learn more about this data set, expand these sections. |
Radio-Frequency (RF) Frame Detection
| This data set comprises 4,831 complex I/Q baseband signals and a pretrained network [19]. The data is collected at a sample rate of 25 MHz for an average duration of 4.5 milliseconds. The data set contains labeled radio frequency (RF) signal recordings from software-defined radio (SDR) captures of real-world wireless transmissions in the 2.4 GHz ISM band for identifying wireless communication protocols. The data set includes six RF signal classes:
You can obtain signal spectrograms using a 256-sample Hann window, 50% overlap between adjoining segments, 256 discrete Fourier transform points, producing time-frequency images with magnitude in dB scale and -80 dB minimum threshold. The high sample rate and detailed time-frequency domain representation enable effective spectrum sensing for cognitive radio and coexistence management in crowded RF environments. To learn more about this data set, expand these sections. |


References
[1] Verma, N. K., Sevakula, R. K., Dixit, S., & Salour, A. (2016). "Intelligent Condition Based Monitoring Using Acoustic Signals for Air Compressors." IEEE Transactions on Reliability, Vol. 65, Number 1, pp. 291–309.
[2] Goldberger, A. L., Amaral, L. A. N., Glass, L., Hausdorff, J. M., Ivanov, P. Ch., Mark, R. G., Mietus, J. E.,, Moody, G. B. , Peng, C.-K., and Stanley, H. E. (2000) "PhysioBank, PhysioToolkit, and PhysioNet: Components of a New Research Resource for Complex Physiologic Signals". Circulation, Vol. 101, Number 23, pp. e215-e220.
[3] Liu et al. "An open access database for the evaluation of heart sound algorithms". (2016) Physiological Measurement, Vol. 37, Number 12, pp. 2181-2213.
[4] Giannoulis, D., Stowell, D., Benetos, E., Rossignol, M., Lagrange, M., and Plumbley, M. D. (2013) "A database and challenge for acoustic scene classification and event detection." 21st European Signal Processing Conference (EUSIPCO 2013), pp. 1–5.
[5] Stowell, D., Giannoulis, D., Benetos, E., Lagrange, M., and Plumbley, M. D. (2015) "Detection and Classification of Acoustic Scenes and Events." IEEE Transactions on Multimedia, Vol. 17, Number 10, pp. 1733–46.
[6] Jakobovski. “Jakobovski/Free-Spoken-Digit-Dataset.” GitHub, May 30, 2019. https://github.com/Jakobovski/free-spoken-digit-dataset.
[7] Mozilla Common Voice Corpus, https://commonvoice.mozilla.org/.
[8] Laguna, P., Mark, R. G., Goldberger, A. L., and Moody, G. B. (1997) "A Database for Evaluation of Algorithms for Measurement of QT and Other Waveform Intervals in the ECG." Computers in Cardiology, Vol. 24, pp. 673–676.
[9] Laguna, P., Jané, R., and Caminal, P. (1994) "Automatic detection of wave boundaries in multilead ECG signals: Validation with the CSE database." Computers and Biomedical Research, Vol. 27, Number 1, pp. 45–60.
[10] Chan, A. D. C., and Green, G. C. (2007) "Myoelectric Control Development Toolbox." 30th Conference of the Canadian Medical & Biological Engineering Society, Toronto, Canada.
[11] Moody, G. B., and Mark, R. G. (2001) "The impact of the MIT-BIH Arrhythmia Database." IEEE Engineering in Medicine and Biology Magazine, Vol. 20, Number 3, pp. 45–50.
[12] Moody, G. B., Muldrow, W. E., and Mark, R. G. (1984) "A noise stress test for arrhythmia detectors." Computers in Cardiology, Vol. 11, pp. 381–384.
[13] Andreotti, F., Behar, J., and Clifford, G. D. (2016) "Fetal ECG Synthetic Database" https://physionet.org/content/fecgsyndb/1.0.0/.
[14] Zhang, H., Zhao, M., Wei, C., Mantini, D., Li, Z., and Liu, Q. (2021) "EEGdenoiseNet: A Benchmark Dataset for End-to-End Deep Learning Solutions of EEG Denoising." arXiv:2009.11662 https://arxiv.org/abs/2009.11662.
[15] Mousavi, S. M., Sheng, Y. , Zhu, W., and Beroza, G. C. (2019) "STanford EArthquake Dataset (STEAD): A Global Data Set of Seismic Signals for AI." IEEE Access, Vol. 7, pp. 179464–76.
[16] Caromi, R., Souryal, M., and Hall, T. A. (2017). "RF Dataset of Incumbent Radar Signals in the 3.5GHz CBRS Band." Journal of Research of the National Institute of Standards and Technology, Vol. 124, Number 124038.
[17] Ahmed, S., Wang, D., Park, J., et al. (2021). "UWB-gestures, a public dataset of dynamic hand gestures acquired using impulse radar sensors." Scientific Data, Vol. 8, Article 102.
[18] Schellenberger, S., Shi, K., Steigleder, T. et al. (2020) "A dataset of clinically recorded radar vital signs with synchronized reference sensor signals." Scientific Data, Vol. 7, Article 291.
[19] Wicht, J., Wetzker, U., and Jain, V. (2022). Spectrogram Data Set for Deep Learning Based RF-Frame Detection. Data, Vol. 7, Number 12, p. 168.
See Also
Topics
- Datastores for Deep Learning (Deep Learning Toolbox)
- Signal Processing Applications (Deep Learning Toolbox)
- Sequence Classification Using Deep Learning (Deep Learning Toolbox)
- Sequence-to-Sequence Classification Using Deep Learning (Deep Learning Toolbox)
- Sequence-to-One Regression Using Deep Learning (Deep Learning Toolbox)
- Manage Data Sets for Machine Learning and Deep Learning Workflows