Main Content

similarityDistance

Compute distance profile between query and time series subsequences

Since R2024b

Description

d = similarityDistance(x,y) returns the vector of z-normalized Euclidean distances between the query sequence y and every subsequence of the time series x with the same length as y.

example

[d,i] = similarityDistance(x,y) also returns the vector i of the starting indices of the subsequences that best match the query in y.

example

[___] = similarityDistance(x,y,EndPoints=outputLengths) specifies how to handle the length of the output vectors when x ends with a partial subsequence.

Use this syntax with any of the input and output arguments in the previous syntaxes.

Examples

collapse all

Load the data, which consists of T1 and T2. T1 is a timetable containing armature current measurements on a degrading DC motor. T2 is a timetable that contains data collected from a known faulty motor.

load matrix_profile_data T1 T2

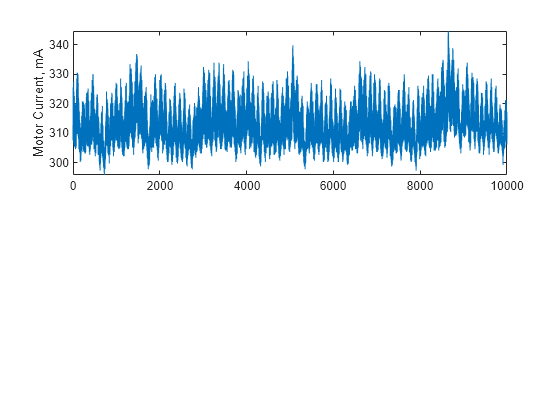
Set x to the MotorCurrent variable in T1. Plot x in a subplot.

x = T1.MotorCurrent;

subplot(211)
plot(x)
ylabel("Motor Current, mA")
hold on

Figure contains an axes object. The axes object with ylabel Motor Current, mA contains an object of type line.

T2 contains anomalous data in a segment that begins at location 3000 and has a length of 100. Extract this data as the target segment y.

len = 100;
loc = 3000;
iy = loc:loc+len-1;
y = T2.MotorCurrent(iy);

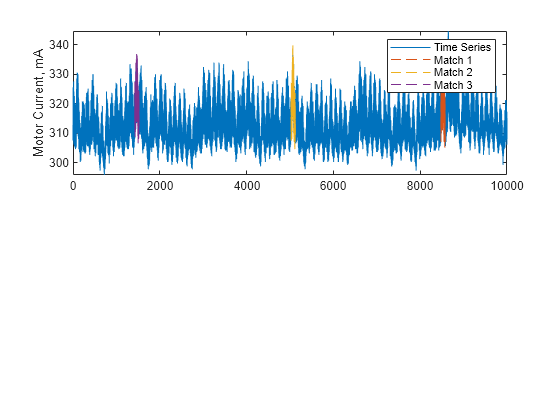
Compute the similarity distance of the target anomaly segment y to the subsequences within the motor data in x.

[d,i] = similarityDistance(x,y);

Using the first three indices in i, plot the three closest matching subsequences. These matches indicate potentially similar anomalies to the anomaly in y.

for k = 1:3
  id = i(k):i(k)+len-1;
  plot(id,x(id),"--");
  hold on
end
legend({"Time Series", "Match 1", "Match 2", "Match 3"})
hold off

Figure contains an axes object. The axes object with ylabel Motor Current, mA contains 4 objects of type line. These objects represent Time Series, Match 1, Match 2, Match 3.

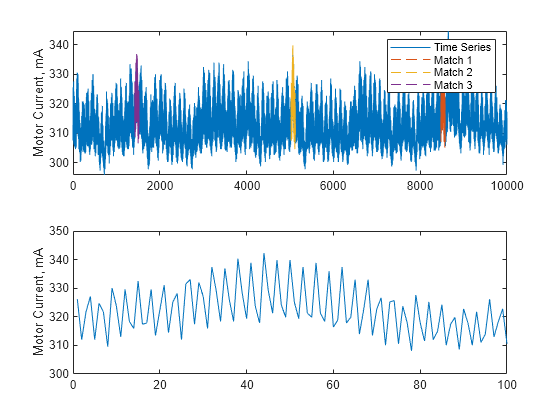
For comparison, plot the target anomaly sequence.

subplot(212)
plot(y);
hold on
ylabel("Motor Current, mA")

Figure contains 2 axes objects. Axes object 1 with ylabel Motor Current, mA contains 4 objects of type line. These objects represent Time Series, Match 1, Match 2, Match 3. Axes object 2 with ylabel Motor Current, mA contains an object of type line.

Plot the data in the three matching subsequences with the target anomaly.

for k = 1:3
  id = i(k):i(k)+len-1;
  plot(x(id),"--");
  hold on
end
legend({"Target Anomaly", "Match 1", "Match 2", "Match 3"})
hold off

Figure contains 2 axes objects. Axes object 1 with ylabel Motor Current, mA contains 4 objects of type line. These objects represent Time Series, Match 1, Match 2, Match 3. Axes object 2 with ylabel Motor Current, mA contains 4 objects of type line. These objects represent Target Anomaly, Match 1, Match 2, Match 3.

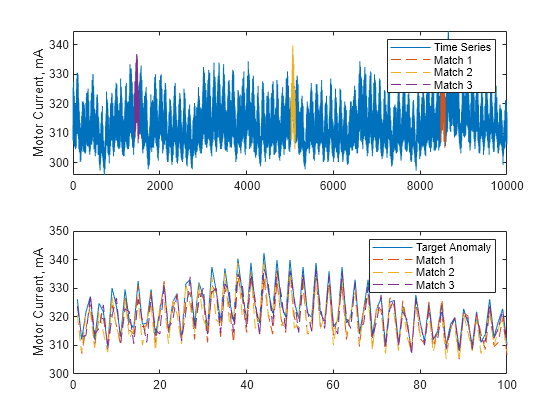
The matching subsequences appear similar to the target anomaly.

Input Arguments

collapse all

Time series to evaluate, specified as a numeric vector of length n. x must not have any missing data.

Query sequence, specified as a numeric vector of length m, where m is less than or equal to the length n of the time series x. y must not have any missing data.

Option for controlling the output length when x ends with a partial subsequence, specified as one of these options:

  • "discard" — Truncate the length of the output vectors d and i to nm + 1, where n is the length of x and m is the length of y.

  • "fill" — Extend the length of d and i to n by padding d with m – 1 NaNs. The software sets the last m – 1 elements of the vector i to the sequence xm + 2:n.

Output Arguments

collapse all

Distance vector containing the z-normalized distances between the query sequence y and the subsequences x(k:k+m-1), where k varies from 1 to n-m+1, returned as a numeric vector of length nm+1.

Vector of starting indices for subsequences of d that best match y, returned as a positive integer vector with the same size as d.

The elements of i sort the elements of d(i) in ascending order of distance, that is, from the best match (smallest distance) to the worst match (largest distance). The best match, therefore, has the starting location of d(i(1)), and the worst match has the starting location of d(i(n-m-1)).

References

[1] Abdullah Mueen, Sheng Zhong, Yan Zhu, Michael Yeh, Kaveh Kamgar, Krishnamurthy Viswanathan, Chetan Kumar Gupta, and Eamonn Keogh, The Fastest Similarity Search Algorithm for Time Series Subsequences Under Euclidean Distance, 2022. https://www.cs.unm.edu/%7Emueen/FastestSimilaritySearch.html

Extended Capabilities

expand all

Version History

Introduced in R2024b