gearConditionMetrics
Standard metrics for gear condition monitoring
Syntax
Description
gearMetrics = gearConditionMetrics(X)gearMetrics using the
vibration data in cell array X.
gearConditionMetrics assumes that each cell element in
X contains columns of time-synchronous averaged (TSA), difference,
regular, and residual signals, in their respective order. If the signals are not in the
same order, then use Name,Value pair arguments.
gearMetrics = gearConditionMetrics(T)gearMetrics from
vibration data set T. gearConditionMetrics assumes
that T contains columns of TSA, difference, regular, and residual
signals, in their respective order. If the signals are not in the same order, then use
Name,Value pair arguments.
gearMetrics = gearConditionMetrics(___,Name,Value)
gearMetrics = gearConditionMetrics(T,sigVar,diffVar,regVar,resVar)gearMetrics from
vibration data set T. Use [] or
'' to skip a signal in the computation. For instance, if the data set
T contains only the TSA and regular signal, use the syntax in the
following
way.
gearMetrics = gearConditionMetrics(T,sigVar,[],regVar,[])
gearMetrics = gearConditionMetrics(___,'SortBy',sortByValue)sortByValue. NA4 depends on the chronological
order of the vibration data since gearConditionMetrics uses the
previous data sets up to the current index to compute the metric.
[
also returns the structure gearMetrics,info] = gearConditionMetrics(___)info containing information about the
table or fileEnsembleDatastore object variables assigned to various
signals.
Examples
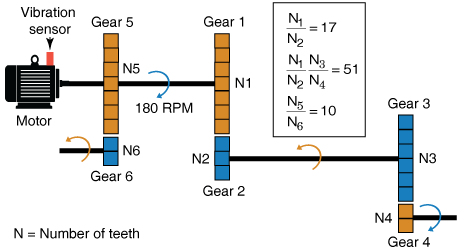
Consider a drivetrain with six gears driven by a motor that is fitted with a vibration sensor, as depicted in the figure below. Gear 1 on the motor shaft meshes with gear 2 with a gear ratio of 17:1. The final gear ratio, that is, the ratio between gears 1 and 2 and gears 3 and 4, is 51:1. Gear 5, also on the motor shaft, meshes with gear 6 with a gear ratio of 10:1. The motor is spinning at 180 RPM, and the sampling rate of the vibration sensor is 50 kHz.
Create the data set.
rpm = 180;
fs = 50e3;
t = (0:1/fs:(1/3)-1/fs)'; % sample times
orderList = [17 51];
f = rpm/60*[1 orderList 10];
In practice, you would use measured data such as vibration signals obtained from an accelerometer. For this example, generate TSA signal X, which is the simulated data from the vibration sensor mounted on the motor, and then compute the difference, regular, and residual signals. Store the signals in a preallocated table.
T = table('Size',[10 4],'VariableTypes',{'cell','cell','cell','cell'},'VariableNames',{'TSA','Diff','Reg','Res'});
for k = 1:10
    X = sin(2*pi*f(1)*t) + sin(2*pi*2*f(1)*t) + ... % motor shaft rotation and harmonic
    3*sin(2*pi*f(2)*t) + 3*sin(2*pi*2*f(2)*t) + ... % gear mesh vibration and harmonic for gears 1 and 2
    4*sin(2*pi*f(3)*t) + 4*sin(2*pi*2*f(3)*t) + ... % gear mesh vibration and harmonic for gears 3 and 4
    2*(k/6)*sin(2*pi*10*f(1)*t) + randn(size(t))/5;    % gear mesh vibration for gears 5 and 6 and noise
  res = tsaresidual(X, fs, rpm, orderList);
  dif = tsadifference(X, fs, rpm, orderList);
  reg = tsaregular(X, fs, rpm, orderList);

  T(k,'TSA') = {X};
  T(k,'Diff') = {dif};
  T(k,'Reg') = {reg};
  T(k,'Res') = {res};
end
T
T=10×4 table
          TSA                 Diff                Reg                 Res
    ________________    ________________    ________________    ________________

    {16666×1 double}    {16666×1 double}    {16666×1 double}    {16666×1 double}
    {16666×1 double}    {16666×1 double}    {16666×1 double}    {16666×1 double}
    {16666×1 double}    {16666×1 double}    {16666×1 double}    {16666×1 double}
    {16666×1 double}    {16666×1 double}    {16666×1 double}    {16666×1 double}
    {16666×1 double}    {16666×1 double}    {16666×1 double}    {16666×1 double}
    {16666×1 double}    {16666×1 double}    {16666×1 double}    {16666×1 double}
    {16666×1 double}    {16666×1 double}    {16666×1 double}    {16666×1 double}
    {16666×1 double}    {16666×1 double}    {16666×1 double}    {16666×1 double}
    {16666×1 double}    {16666×1 double}    {16666×1 double}    {16666×1 double}
    {16666×1 double}    {16666×1 double}    {16666×1 double}    {16666×1 double}
T is a 10x4 table, where each element is a cell array.
Compute the gear condition monitoring metrics using the data set in table T.
[gearMetrics1,info1] = gearConditionMetrics(T,'SignalVariable','TSA','DifferenceVariable','Diff','RegularVariable','Reg','ResidualVariable','Res')
gearMetrics1=10×9 table
     RMS      Kurtosis    CrestFactor     FM4       M6A       M8A       FM0      EnergyRatio     NA4
    ______    ________    ___________    ______    ______    ______    ______    ___________    ______

    5.1119      2.074       2.4377       2.4633    9.0009     42.31    1.5499     0.060057      2.4637
    5.1272      2.087       2.4819       1.9331    4.9869    15.634    1.5785      0.10044      4.1973
    5.1526      2.102       2.4744       1.7084    3.6211    8.8635    1.5881      0.14423      5.5871
    5.1877     2.1264       2.5443         1.63    3.1749    6.9296    1.6424      0.18889      6.7318
    5.2385     2.1566       2.5985       1.5861    2.9421    6.0165    1.6937      0.23407      7.6258
    5.2953     2.1879        2.605       1.5604    2.8046    5.4734    1.7211      0.28052      8.3807
     5.365     2.2277       2.6551       1.5423    2.7169    5.1619    1.7761      0.32511      8.8352
    5.4425     2.2574       2.6428       1.5356    2.6796     5.016    1.7945      0.37196      9.3879
    5.5269     2.2891       2.7112       1.5269    2.6344    4.8502    1.8614      0.41819      9.7477
    5.6219     2.3214       2.6979       1.5202    2.6015    4.7342    1.8892      0.46377      10.022
info1 = struct with fields:
        SignalVariable: 'TSA'
    DifferenceVariable: 'Diff'
       RegularVariable: 'Reg'
      ResidualVariable: 'Res'
                SortBy: [1×0 char]
Observe that the gear metrics are changing due to fault in gear mesh between gears 5 and 6. The NA4 value is highly sensitive to the fault and its propagation as it significantly increases in value over the different data sets.
info1 contains information about variables that were used to compute the metrics.
Alternatively, you can also compute the metrics using following syntax.
[gearMetrics2,info2] = gearConditionMetrics(T,'TSA','Diff','Reg','Res')
gearMetrics2=10×9 table
     RMS      Kurtosis    CrestFactor     FM4       M6A       M8A       FM0      EnergyRatio     NA4
    ______    ________    ___________    ______    ______    ______    ______    ___________    ______

    5.1119      2.074       2.4377       2.4633    9.0009     42.31    1.5499     0.060057      2.4637
    5.1272      2.087       2.4819       1.9331    4.9869    15.634    1.5785      0.10044      4.1973
    5.1526      2.102       2.4744       1.7084    3.6211    8.8635    1.5881      0.14423      5.5871
    5.1877     2.1264       2.5443         1.63    3.1749    6.9296    1.6424      0.18889      6.7318
    5.2385     2.1566       2.5985       1.5861    2.9421    6.0165    1.6937      0.23407      7.6258
    5.2953     2.1879        2.605       1.5604    2.8046    5.4734    1.7211      0.28052      8.3807
     5.365     2.2277       2.6551       1.5423    2.7169    5.1619    1.7761      0.32511      8.8352
    5.4425     2.2574       2.6428       1.5356    2.6796     5.016    1.7945      0.37196      9.3879
    5.5269     2.2891       2.7112       1.5269    2.6344    4.8502    1.8614      0.41819      9.7477
    5.6219     2.3214       2.6979       1.5202    2.6015    4.7342    1.8892      0.46377      10.022
info2 = struct with fields:
        SignalVariable: 'TSA'
    DifferenceVariable: 'Diff'
       RegularVariable: 'Reg'
      ResidualVariable: 'Res'
                SortBy: [1×0 char]
Consider gearData.zip, a collection of 9 data sets where each file contains separate timetables for the TSA, difference, regular and residual signals.
Extract the compressed files, read the data in the timetables, and create a fileEnsembleDatastore object using the timetable data. For more information on creating a file ensemble datastore, see fileEnsembleDatastore.
unzip gearData.zip;
ens = fileEnsembleDatastore(pwd,'.mat');
ens.ReadFcn = @readData;
ens.DataVariables = {'TSA','Diff','Reg','Res'};
ens.SelectedVariables = ens.DataVariables;
Compute the gear condition metrics using the data in the ensemble datastore.
[gearMetrics,info] = gearConditionMetrics(ens,'SignalVariable','TSA','DifferenceVariable','Diff','RegularVariable','Reg','ResidualVariable','Res')
gearMetrics=9×9 table
     RMS      Kurtosis    CrestFactor     FM4       M6A       M8A       FM0      EnergyRatio     NA4
    ______    ________    ___________    ______    ______    ______    ______    ___________    ______

    5.1119     2.0734       2.3417       2.4977    9.3854    45.859    1.4919     0.060189      2.4981
    5.1271      2.086       2.3714       1.9236    4.9222    15.262    1.5155      0.10018      4.1509
    5.1526      2.101       2.3938       1.7199    3.6873    9.1708    1.5398      0.14418      5.6187
    5.1882     2.1247       2.4128       1.6283    3.1667    6.9051    1.5589      0.18951      6.7806
     5.238     2.1572         2.45       1.5816    2.9135    5.8919    1.5994      0.23373      7.5444
    5.2947     2.1888       2.4253       1.5571    2.7877    5.4113    1.5956      0.28007      8.3138
    5.3657      2.226       2.4526       1.5443    2.7251    5.1856    1.6297      0.32562      8.8783
    5.4421     2.2564        2.447       1.5341    2.6718    4.9888    1.6549      0.37177      9.3428
    5.5254     2.2867       2.4349       1.5269    2.6354    4.8572    1.6763      0.41747      9.6986
info = struct with fields:
        SignalVariable: 'TSA'
    DifferenceVariable: 'Diff'
       RegularVariable: 'Reg'
      ResidualVariable: 'Res'
                SortBy: [1×0 char]
The output table contains 9 rows of metrics where each row corresponds to one data set.
Input Arguments
Name-Value Arguments
Output Arguments
Algorithms
Root Mean Square (RMS)
The root mean square (RMS) of the TSA signal is computed using the rms command. For
a TSA signal x, RMS is computed as,
Here, N is the number of data samples.
RMS is usually a good indicator of the overall condition of gearboxes,
but not a good indicator of incipient tooth failure. It is also useful to detect unbalanced
rotating elements. RMS of a standard normal distribution is 1.
For more information, see rms.
Kurtosis
Kurtosis is a measure of how outlier-prone a distribution is. The kurtosis of a standard normal distribution is 3. Distributions that are more outlier-prone have kurtosis values greater than 3; distributions that are less outlier-prone have kurtosis values less than 3.
gearConditionMetrics computes the kurtosis value of the TSA signal
using the kurtosis command. The kurtosis of a sequence is
defined as,
Here, is the mean of the TSA signal x.
For more information, see kurtosis.
Crest Factor (CF)
Crest Factor is the ratio of the positive peak value of the input
signal x to the RMS value. gearConditionMetrics
computes the crest factor of the TSA signal using the peak2rms command.
The crest factor of a sequence is defined as,
Here, P(x) is the peak value of the TSA signal.
The crest factor indicates the relative size of peaks to the effective value of the signal. It is a good indicator of gear damage in its early stages, where vibration signals exhibit impulsive traits.
FM4
The FM4 indicator is used to detect faults isolated to only a limited
number of teeth in a gear mesh. FM4 is defined as the normalized kurtosis
of the difference signal [4]. FM4
of a standard normal distribution is 3.
FM4 is computed as,
where, is the mean of the difference signal d.
M6A
The M6A indicator is used to detect surface damage on machinery
components. M6A employs the same theory as the FM4
metric, but uses the sixth moment of the difference signal normalized by the cube of the
variance. M6A of a standard normal distribution is 15. Hence,
M6A is expected to be more sensitive to peaks in the difference signal.
gearConditionMetrics uses the moment command to compute M6A.
M6A is computed as,
where, is the mean of the difference signal d.
M8A
The M8A indicator is an improved version of M6A. It
is expected to be more sensitive to peaks in the difference signal since
M8A is normalized by the fourth power of the variance.
M8A of a standard normal distribution is 105. It is computed as,
FM0
FM0 is useful in detecting major anomalies in the gear meshing pattern.
It does so by comparing the maximum peak-to-peak amplitude of the TSA signal to the sum of the
amplitudes of the meshing frequencies and their harmonics.
gearConditionMetrics uses a combination of peak2peak and fft commands to compute the
FM0 metric.
FM0 is computed as,
where, PP(x) is the peak-to-peak values of the TSA signal. A contains the frequency-domain amplitudes at the mesh frequencies and their harmonics, which represents the energy of the regular signal.
A is computed as,
where, R(t) is the regular signal.
Energy Ratio (ER)
Energy Ratio is defined as the ratio of the standard deviations of the
difference and regular signals [1]. It is useful as an
indicator of heavy uniform wear, where multiple teeth on the gear are damaged.
Energy Ratio is computed as,
where, d and R represent the difference and regular signals, respectively.
NA4
NA4 is an improved version of the FM4 indicator
[3]. NA4
indicates the onset of damage and continues to react to the damage as it spreads and increases
in magnitude.
NA4 is computed as,
where the normalization is across all vibration data sets up to the current time k using the running average of variances of residual signals.
References
[1] Keller, Jonathan A., and P. Grabill. "Vibration monitoring of UH-60A main transmission planetary carrier fault." Annual Forum Proceedings-American Helicopter Society. Vol. 59. No. 2. American Helicopter Society, Inc, 2003.
[2] Večeř, P., Marcel Kreidl, and R. Šmíd. "Condition indicators for gearbox condition monitoring systems." Acta Polytechnica pages 35-43, 45.6 (2005).
[3] Zakrajsek, James J., Dennis P. Townsend, and Harry J. Decker. "An analysis of gear fault detection methods as applied to pitting fatigue failure data." Technical Memorandum 105950. No. NASA-E-7470. NASA, 1993.
[4] Zakrajsek, James J. "An investigation of gear mesh failure prediction techniques." MS Thesis-Cleveland State University, 1989.
Extended Capabilities
Version History
Introduced in R2019a