Main Content

plotTDOASpectrum

Create and plot signal time-difference-of-arrival (TDOA) spectrum

Since R2024b

Description

Create and plot the signal time-difference-of-arrival (TDOA) spectrum for anchor pair.

[tdoagrid,tdoaspectrum,tdoaest] = plotTDOASpectrum(estimate) creates and plots the time-difference-of-arrival (TDOA) grid, tdoagrid, the TDOA spectrum, tdoaspectrum, and the estimated TDOA, tdoaest, for the first anchor pair derived from the phased.TDOAEstimator System object™ estimate.

To use this function, first create and execute the phased.TDOAEstimator System object.

example

[tdoagrid,tdoaspectrum,tdoaest] = plotTDOASpectrum(estimate,Name=Value) also specifies one or more Name-Value arguments, in addition to the input arguments from the previous syntax . For example, AnchorPairIndex=4 specifies the fourth anchor pair in the channel (see Name-Value Arguments). You can specify multiple name-value pair arguments in any order as Name1=Value1,...,NameN=ValueN.

Examples

collapse all

Start with signals from five anchors with known positions. Perform TDOA estimation by applying the GCC-PHAT algorithm in phased.TDOAEstimator System object™ on the received signals from a target. The TOAEstimatorExampleData mat-file contains the variables needed in this example:

Xtime

Time-domain received signals

fs

Sample rate (Hz)

toa

Time-of-arrival at each anchor

anchorpos

Anchor positions

npow

Noise power

Load data from the mat-file.

load TOAEstimatorExampleData

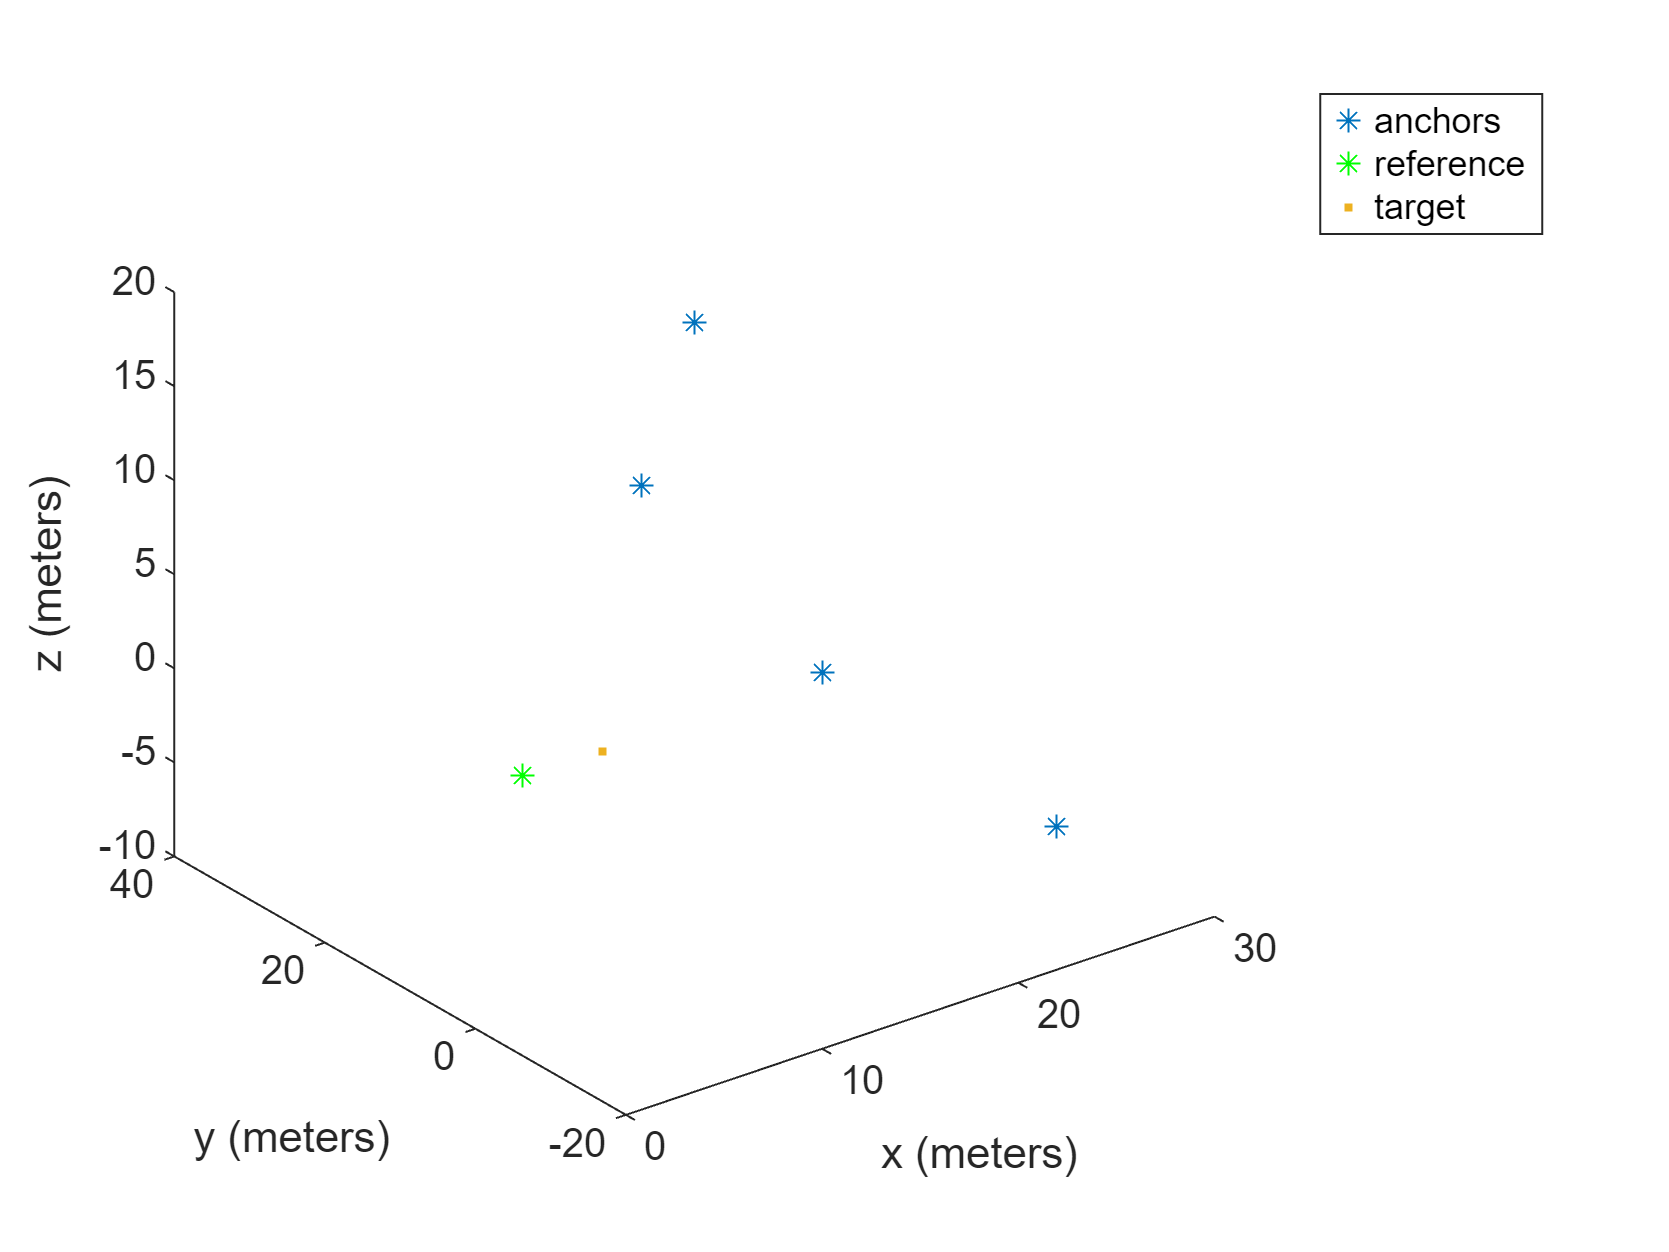
Plot the anchor positions and target position.

plot3(anchorpos(1,:),anchorpos(2,:),anchorpos(3,:),'*')
hold on
plot3(anchorpos(1,1),anchorpos(2,1),anchorpos(3,1),'*g')

plot3(tgtpos(1),tgtpos(2),tgtpos(3),'.')
xlabel('x (meters)')
ylabel('y (meters)')
zlabel('z (meters)')
hold off
legend('anchors','reference','target')

Figure contains an axes object. The axes object with xlabel x (meters), ylabel y (meters) contains 3 objects of type line. One or more of the lines displays its values using only markers These objects represent anchors, reference, target.

Create a TDOA estimator.

estimator = phased.TDOAEstimator(SampleRate=fs,NumEstimates=1, ...
    VarianceOutputPort=true,NoisePower=npow);

Perform the TDOA estimation.

tdoaest = estimator(Xtime)*10^9;

Obtain the true TDOA in ns from the mat-file.

tdoatruth = (toa(2:end) - toa(1))*10^9
tdoatruth = 1×4

   55.7611   58.8663   69.5528   43.5516

tdif = tdoaest - tdoatruth
tdif = 1×4

    0.2389    0.1337    0.4472    0.4484

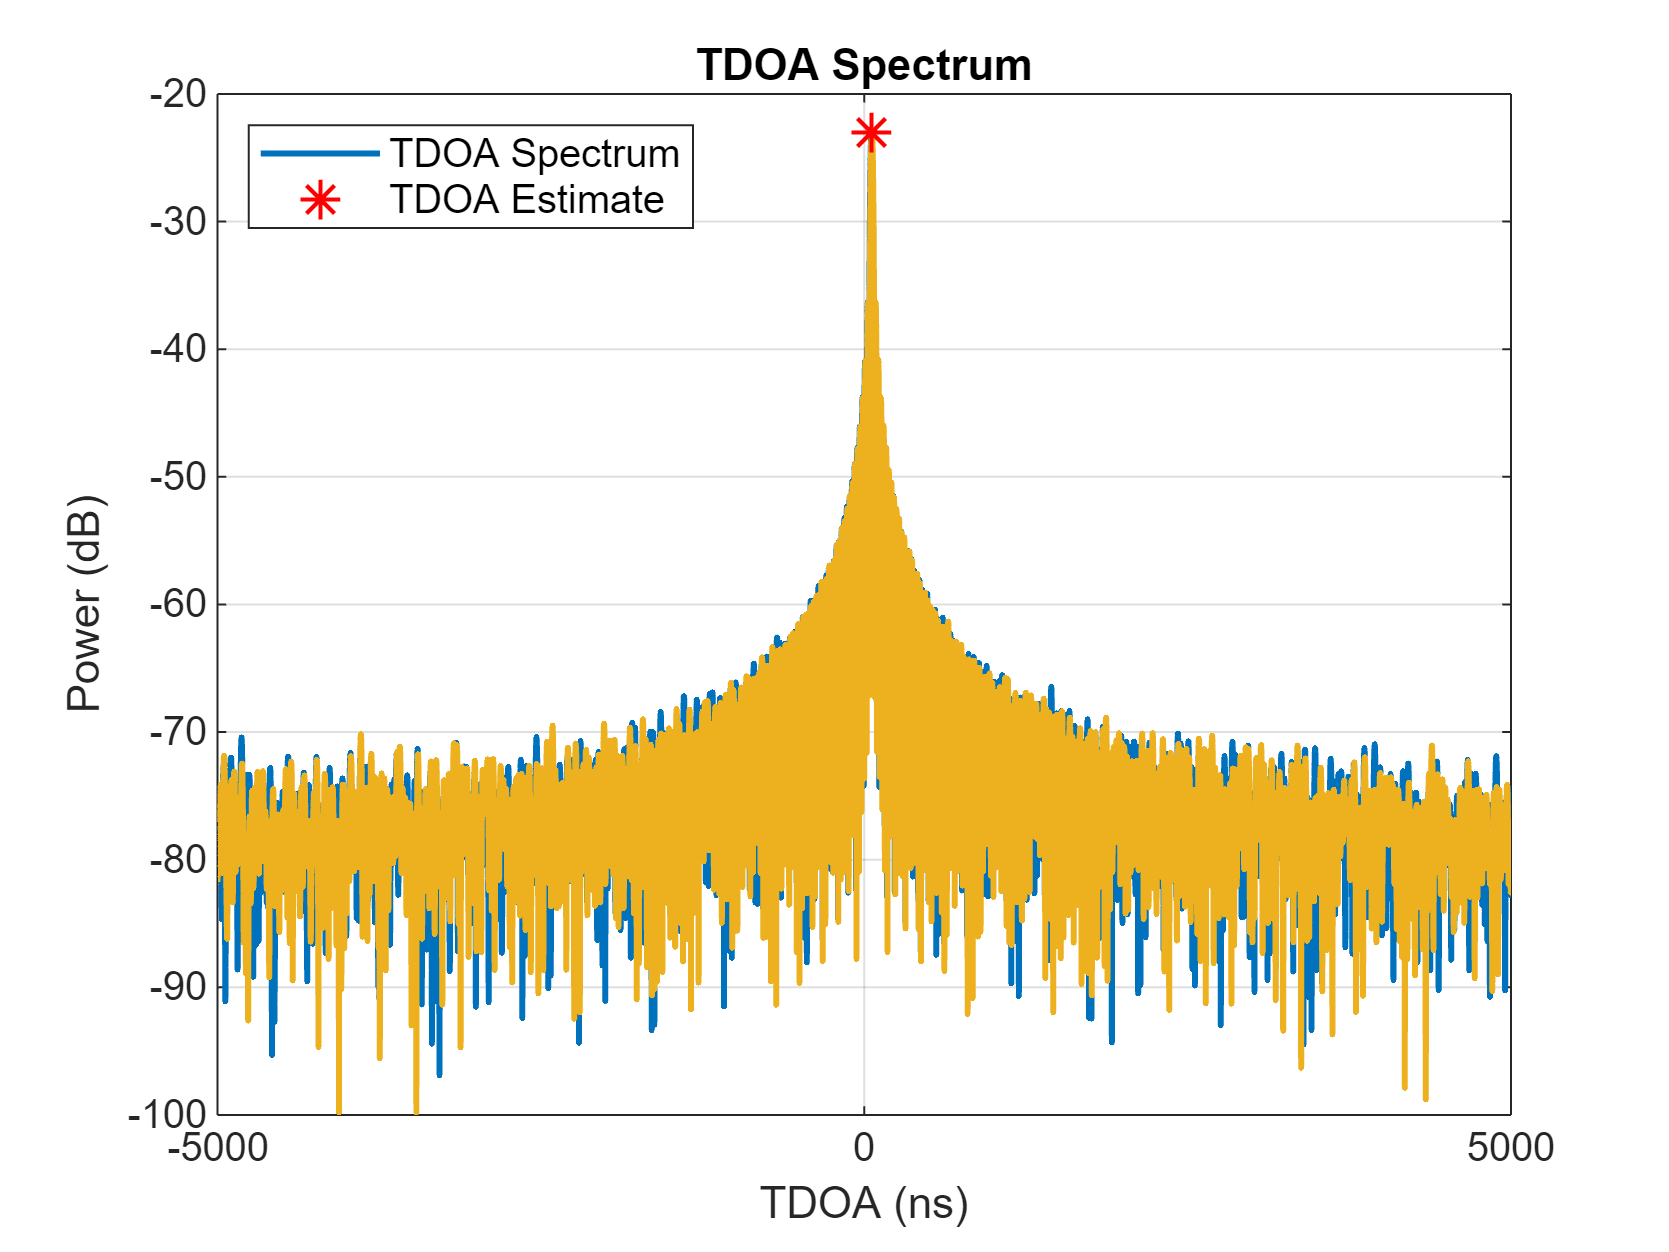
Plot the TDOA spectrum for the first anchor pair (default).

plotTDOASpectrum(estimator)

Overlay the plot of the TDOA spectrum for the second anchor pair.

plotTDOASpectrum(estimator,AnchorPairIndex=2)

Figure contains an axes object. The axes object with title TDOA Spectrum, xlabel TDOA (ns), ylabel Power (dB) contains 4 objects of type line. One or more of the lines displays its values using only markers These objects represent TDOA Spectrum, TDOA Estimate.

Input Arguments

collapse all

TDOA estimator, specified as a phased.TDOAEstimator System object.

Name-Value Arguments

Specify optional pairs of arguments as Name1=Value1,...,NameN=ValueN, where Name is the argument name and Value is the corresponding value. Name-value arguments must appear after other arguments, but the order of the pairs does not matter.

Example: plotTDOASpectrum(estimator,freqspacing,AnchorPairIndex=4) specifies the fourth anchor pair in the channel.

Anchor pair index, specified as a positive integer from 1 to L–1 where L is the number of anchors.

Example: AnchorPairIndex=4

Data Types: single | double

Maximum delay difference in the TDOA spectrum, specified as a positive scalar. The default value is the maximum unambiguous delay difference. Units are in seconds.

Example: MaxDelay=1e-6

Data Types: double

Output Arguments

collapse all

Time-difference-of-arrival grid, returned as a P-by-1 real-valued vector. All returned TDOA values lie on this grid. The function determines the value of P. Units are in seconds.

Data Types: single | double

TDOA spectrum, returned as a P-by-1 real-valued vector. The function determines the value of P. Units are in Hz.

TDOA estimate, returned as a scalar. Units are in seconds.

Data Types: single | double

Version History

Introduced in R2024b