uifigure
Create figure for designing apps
Description
fig = uifigureFigure object. This is
the type of figure that App Designer uses.
fig = uifigure(Name=Value)
Examples
Create a blank figure for app building.
fig = uifigure;
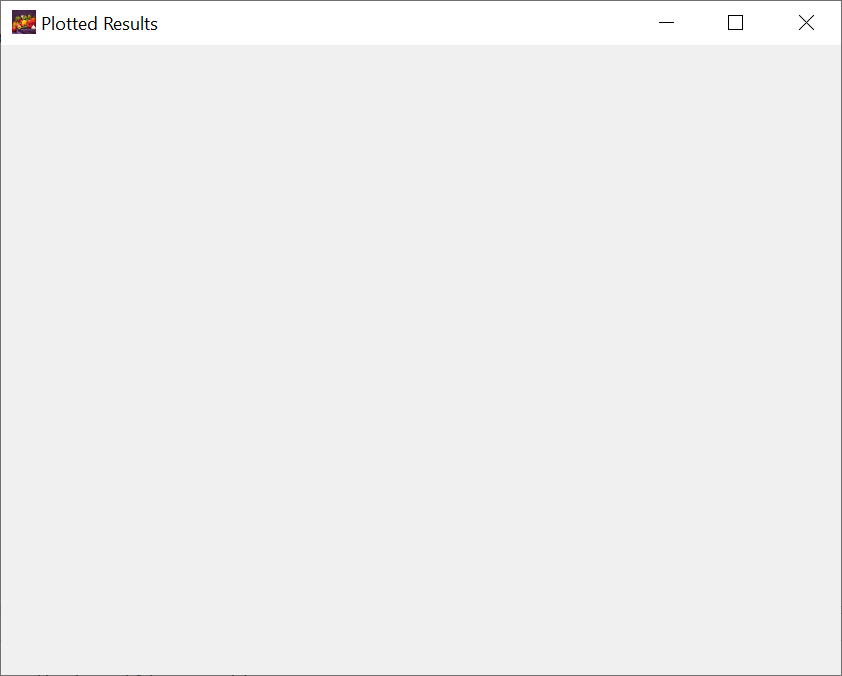
Create a UI figure with a specific title and icon.
fig = uifigure("Name","Plotted Results", ...
    "Icon","peppers.png");
Query the figure background color.
c = fig.Color
c = 1×3

    0.9608    0.9608    0.9608
Create a default UI figure.
fig = uifigure;
Get the location, width, and height of the figure.
fig.Position
ans =

   681   559   560   420
This means that the figure window is positioned 681 pixels to the right and 559 pixels above the bottom left corner of the primary display, and is 560 pixels wide and 420 pixels tall.
Halve the figure width and height by adjusting the third and fourth elements of the position vector.
fig.Position(3:4) = [280 210];
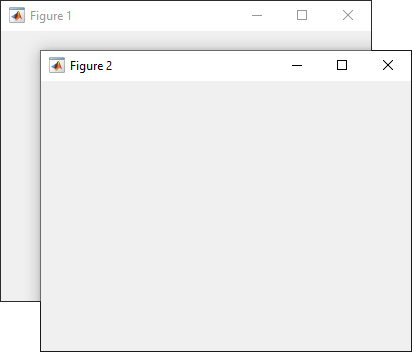
Create two UI figure windows. Block interactions in Figure 1 by specifying
"modal" as the WindowStyle
property value for Figure 2. You cannot interact with Figure 1 until Figure
2 is closed.
fig1 = uifigure(Name="Figure 1");
fig1.Position = [500 500 370 270];

fig2 = uifigure(Name="Figure 2");
fig2.Position = [540 450 370 270];
fig2.WindowStyle = "modal";
Code the CloseRequestFcn callback to
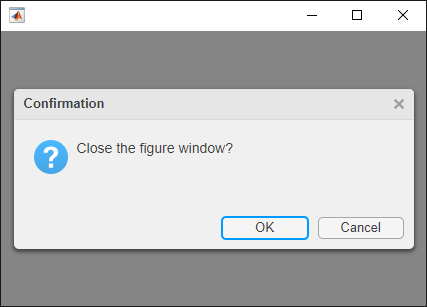
open a modal confirmation dialog box when the user tries to close the window.
Copy and paste this code into the MATLAB® Editor, and then run closeFig.
function closeFig
fig = uifigure(Position=[100 100 425 275]);
fig.CloseRequestFcn = @(src,event)my_closereq(src);

    function my_closereq(fig)
        selection = uiconfirm(fig,"Close the figure window?",...
            "Confirmation");

        switch selection
            case 'OK'
                delete(fig)
            case 'Cancel'
                return
        end
    end

end
Click the figure close button. The confirmation dialog box opens.
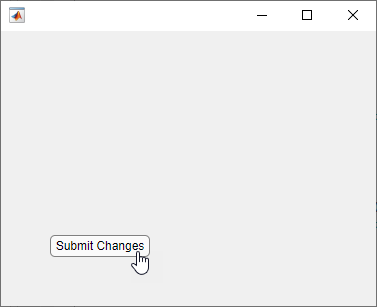
Change the displayed mouse pointer symbol when you hover over a push button.
This program file, called setMousePointer.m, shows you
how to:
Create a UI figure which executes custom code when the mouse is moved over a button. To do this, use the
@operator to assign themouseMovedfunction handle to theWindowButtonMotionFcnproperty of the figure.Create a push button and specify its coordinates and label.
Create a callback function called
mouseMovedwith the custom code you want to execute when the mouse moves over the button. In the function, query theCurrentPointproperty to determine the mouse pointer coordinates. Set thePointerproperty to"hand"if the pointer coordinates are within the push button coordinates.
Run setMousePointer. Then move the mouse over the push
button to see the mouse pointer symbol change from an arrow to a
hand.
function setMousePointer
fig = uifigure(Position=[500 500 375 275]);
fig.WindowButtonMotionFcn = @mouseMoved;

btn = uibutton(fig);
btnX = 50;
btnY = 50;
btnWidth = 100;
btnHeight = 22;
btn.Position = [btnX btnY btnWidth btnHeight];
btn.Text = "Submit Changes";

    function mouseMoved(src,event)
        mousePos = fig.CurrentPoint;
        if (mousePos(1) >= btnX) && (mousePos(1) <= btnX + btnWidth) ...
                && (mousePos(2) >= btnY) && (mousePos(2) <= btnY + btnHeight)
              fig.Pointer = "hand";
        else
              fig.Pointer = "arrow";
        end
    end
end
Name-Value Arguments
Specify optional pairs of arguments as
Name1=Value1,...,NameN=ValueN, where Name is
the argument name and Value is the corresponding value.
Name-value arguments must appear after other arguments, but the order of the
pairs does not matter.
Example: uifigure(Name="My App") specifies My
App as the title of the UI figure.
Note
The properties listed here are a subset of the available properties. For the
full list, see Figure.
Window style, specified as one of these values:
'normal'— The figure appears in a standalone window, independent of other MATLAB windows.'docked'— The figure is docked into the desktop.'modal'— The figure appears on top of all existing figure windows that have a normal window style, making them inaccessible as long as the top figure exists and remains modal.When multiple modal windows exist, the most recently created window keeps focus and stays on top of all other windows until it becomes invisible, or is returned to a normal window style, or is deleted. At that time, focus reverts to the window that last had focus.
'alwaysontop'— The figure appears on top of all other windows, including modal figure windows and windows from applications other than MATLAB. The other windows are still accessible.
Note
These are some important characteristics of the
WindowStyle property and some
recommended best practices:
When you create UI windows, specify the
WindowStyleproperty. If you also want to set theResizeorPositionproperties of the figure, then set theWindowStyleproperty first.You can change the
WindowStyleproperty of a figure at any time, including when the figure is visible and contains children. However on some systems, setting this property might cause the figure to flash or disappear and reappear, depending on the system's implementation of normal and modal windows. For best visual results, set theWindowStyleproperty at creation time or when the figure is invisible.
UI Figure Modal Window Style Behavior
When WindowStyle is set to
'modal', the UI figure window blocks
keyboard and mouse interactions in a UI figure window that was
created before it and has its Visible property
set to 'on'. For instance, in this example Figure
3 is modal with respect to Figure 2 and Figure 2 is modal with
respect to Figure
1.
fig1 = uifigure('Name','Figure 1');
fig1.WindowStyle = 'modal';

fig2 = uifigure('Name','Figure 2');
fig2.WindowStyle = 'modal';

fig3 = uifigure('Name','Figure 3');
fig3.WindowStyle = 'modal';
Unlike modal figures created with the figure
function, modal figures created with the uifigure
function do not block access to figures created with the figure
function or the MATLAB desktop. Interactions with application windows other
than MATLAB are also not blocked.
Pressing Ctrl+C when a modal figure has focus causes
that figure to revert to a 'normal'
WindowStyle property setting. This allows the
user to type at the command line.
UI figures with the WindowStyle property set to
'modal' and the
Visible property set to
'off' do not behave modally until
MATLAB makes them visible. Therefore, you can hide a modal
window for later reuse, instead of destroying it.
Modal figures do not display menu children, built-in menus, or
toolbars. But, it is not an error to create menus in a modal figure
or to change the WindowStyle property setting
to 'modal' on a figure with menu children. The
Menu objects exist and the figure retains
them. If you reset the UI figure WindowStyle
property to 'normal', the menus display.
Name of the figure, specified as a character vector or a string scalar.
Example: uifigure('Name','Results') sets the name of the figure to
'Results'.
In App Designer, the default value of the Name property is
'MATLAB App'.
Location and size of the figure, excluding borders, figure tools, and
title bar, specified as a four-element vector of the form [left
bottom width height].
This table describes each element in the vector.
| Element | Description |
|---|---|
left | Distance from the left edge of the primary display to the inner left edge of the window. This value can be negative on systems that have more than one monitor. If the figure is docked, then this value is relative to its container. |
bottom | Distance from the bottom edge of the primary display to the inner bottom edge of the window. This value can be negative on systems that have more than one monitor. If the figure is docked, then this value is relative to its container. |
width | Distance between the right and left inner edges of the window. |
height | Distance between the top and bottom inner edges of the window. |
All measurements are in units specified by the
Units property.
To position the full window, including the borders, figure tools, and
title bar, use the OuterPosition
property.
Note
The Windows® operating system enforces a minimum window width and a maximum window size. If you specify a figure size outside of those limits, the displayed figure conforms to the limits instead of the size you specified.
Tips
Use the graphics root object to set default values on the root level for other types of objects. For example, set the default colormap for all future figures to the
summercolormap.To restore a property to its original MATLAB default, use theset(groot,"DefaultFigureColormap",summer)'remove'keyword.For more information on setting default values, see Default Property Values.set(groot,"DefaultFigureColormap","remove")
To bring a figure window to the front, use the
focusfunction.
Version History
Introduced in R2016aTo keep a specific UI figure window in front of other windows, set the
WindowStyle property to "alwaysontop".
Unlike modal figures, UI figure windows with this property setting do not restrict
keyboard and mouse interactions.
To restrict keyboard and mouse interactions to a specific UI figure window, set
the WindowStyle property to "modal".
To add a custom icon to a UI figure window, set the Icon
property to an image file or an m-by-n-by-3
truecolor array.
MATLAB Command
You clicked a link that corresponds to this MATLAB command:
Run the command by entering it in the MATLAB Command Window. Web browsers do not support MATLAB commands.
Select a Web Site
Choose a web site to get translated content where available and see local events and offers. Based on your location, we recommend that you select: .
You can also select a web site from the following list
How to Get Best Site Performance
Select the China site (in Chinese or English) for best site performance. Other MathWorks country sites are not optimized for visits from your location.
Americas
- América Latina (Español)
- Canada (English)
- United States (English)
Europe
- Belgium (English)
- Denmark (English)
- Deutschland (Deutsch)
- España (Español)
- Finland (English)
- France (Français)
- Ireland (English)
- Italia (Italiano)
- Luxembourg (English)
- Netherlands (English)
- Norway (English)
- Österreich (Deutsch)
- Portugal (English)
- Sweden (English)
- Switzerland
- United Kingdom (English)