ndgrid
Rectangular grid in N-D space
Description
[
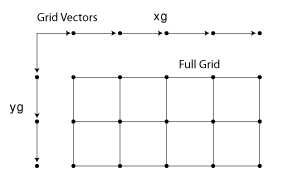
replicates the grid vectors X1,X2,...,Xn]
= ndgrid(x1,x2,...,xn)x1,x2,...,xn to produce an
n-dimensional full grid.
[ specifies a single grid vector
X1,X2,...,Xn]
= ndgrid(xg)xg to use for all dimensions. The number of output arguments
you specify determines the dimensionality n of the output.
Examples
Create a 2-D grid from the vectors [1 3 5 7 9 11 13 15 17 19] and [2 4 6 8 10 12].
[X,Y] = ndgrid(1:2:19,2:2:12)
X = 10×6

     1     1     1     1     1     1
     3     3     3     3     3     3
     5     5     5     5     5     5
     7     7     7     7     7     7
     9     9     9     9     9     9
    11    11    11    11    11    11
    13    13    13    13    13    13
    15    15    15    15    15    15
    17    17    17    17    17    17
    19    19    19    19    19    19
Y = 10×6

     2     4     6     8    10    12
     2     4     6     8    10    12
     2     4     6     8    10    12
     2     4     6     8    10    12
     2     4     6     8    10    12
     2     4     6     8    10    12
     2     4     6     8    10    12
     2     4     6     8    10    12
     2     4     6     8    10    12
     2     4     6     8    10    12
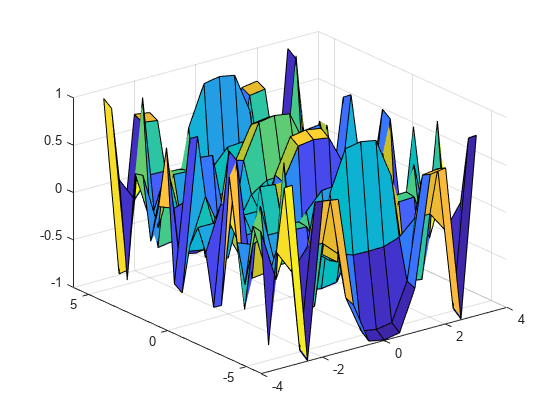
Create a rectangular grid and calculate function values on the grid. Interpolate between the assigned values to refine the grid.
Create a coarse grid for , where the range of is and the range of is .
[X,Y] = ndgrid(-6:0.5:6,-3:0.5:3);
Evaluate the function at the locations defined in the grid. Then, visualize the function using a surface plot. Alternatively, since R2016b, you can use implicit expansion for this task.
f = sin(X.^2) .* cos(Y.^2);
surf(Y,X,f)
Interpolate between the points on a more refined grid (Xq,Yq). Then, visualize the interpolated values using a surface plot.
[Xq,Yq] = ndgrid(-6:0.125:6,-3:0.125:3);
F = interpn(X,Y,f,Xq,Yq,"spline");
surf(Yq,Xq,F)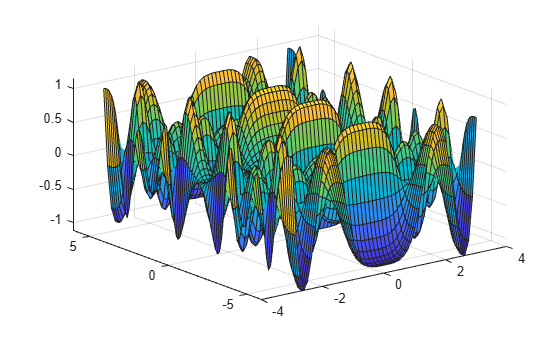
Input Arguments
Grid vectors, specified as vectors containing grid coordinates for each dimension. The grid vectors implicitly define the grid. For example, in 2-D:
Data Types: single | double | int8 | int16 | int32 | int64 | uint8 | uint16 | uint32 | uint64
Complex Number Support: Yes
Grid vector for all dimensions, specified as a vector containing grid
coordinates. ndgrid uses xg as the
grid vector for each dimension.
Data Types: single | double | int8 | int16 | int32 | int64 | uint8 | uint16 | uint32 | uint64
Complex Number Support: Yes
Output Arguments
More About
Extended Capabilities
Version History
Introduced before R2006a