figure
Create figure window
Description
figure creates a new figure window using
default property values. The resulting figure is the current figure.
figure( modifies
properties of the figure using one or more name-value pair arguments.
For example, Name,Value)figure('Color','white') sets the background
color to white.
figure( makes the
figure specified by f)f the current figure and
displays it on top of all other figures.
figure( finds a
figure in which the n)Number property is equal
to n, and makes it the current figure. If no
figure exists with that property value, MATLAB® creates a new
figure and sets its Number property to n.
Examples
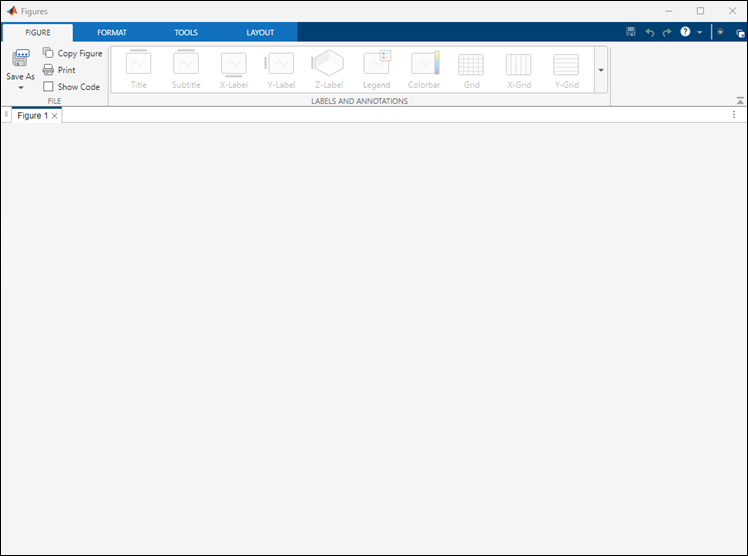
Create a default figure. The figure appears as a tab in a figure container.
f = figure;
Get the location, width, and height of the figure.
f.Position
ans =

    1    1    1070    620
This means that the figure is positioned with its bottom left corner adjacent to the corner of the figure container, and the figure is 1070 pixels wide and 620 pixels tall.
You can resize the figure container interactively. Alternatively, you can
specify the figure size by setting its Position
property, which undocks the figure from the figure container. For example,
position the figure to be 100 pixels to the right and 200 pixels above the
bottom left corner of the primary display, and specify its size to be 500
pixels wide and 300 pixels tall.
f.Position = [100 200 500 300];
Create a figure, and specify the Name property.
By default, the resulting title includes the figure number.
figure(Name="Measured Data");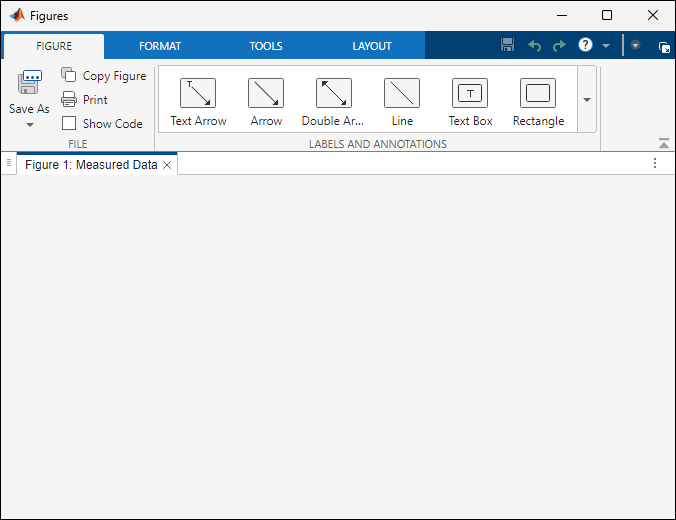
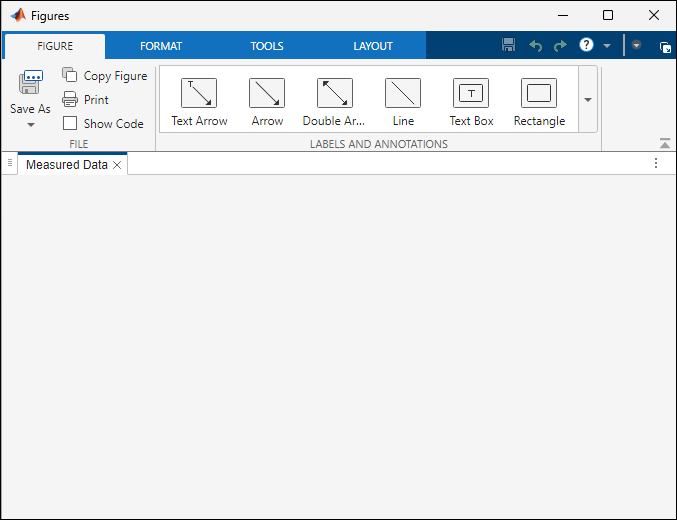
Specify the Name property again, but this time, set
the NumberTitle property to "off".
The resulting title does not include the figure number.
figure(Name="Measured Data",NumberTitle="off");
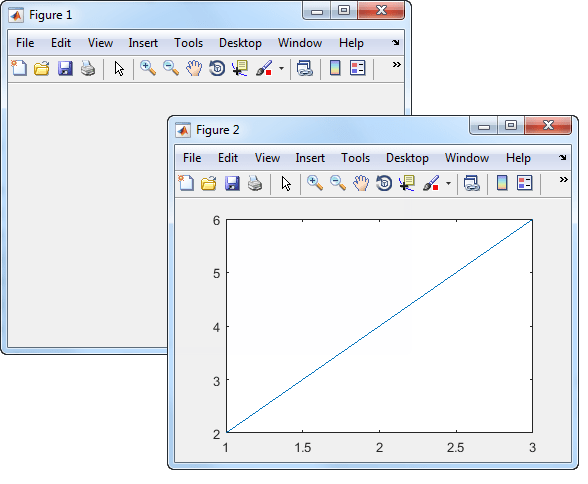
Create two figures, and then create a line plot. The figures appear as
tabs in a figure container. By default, the plot
command targets the current figure.
f1 = figure;
f2 = figure;
plot([1 2 3],[2 4 6]);
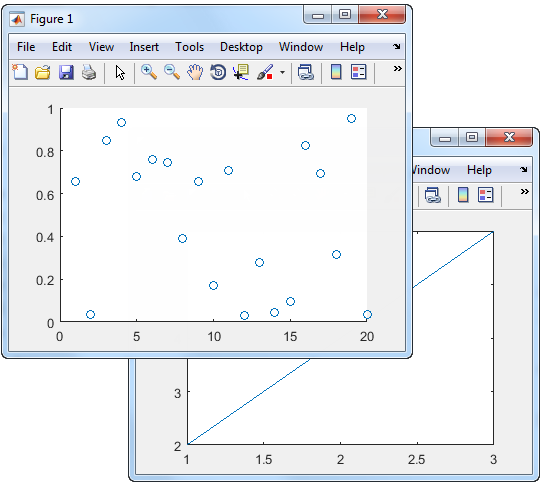
Set the current figure to f1, so that
it is the target for the next plot. Then create a scatter plot.
figure(f1);
scatter((1:20),rand(1,20));
Input Arguments
Name-Value Arguments
Specify optional pairs of arguments as
Name1=Value1,...,NameN=ValueN, where Name is
the argument name and Value is the corresponding value.
Name-value arguments must appear after other arguments, but the order of the
pairs does not matter.
Example: figure(Color="white") creates a figure with a white
background.
Before R2021a, use commas to separate each name and value, and enclose
Name in quotes.
Example: figure("Color","white") creates a figure with a white
background.
Note
The properties listed here are only a subset. For a full list,
see Figure.
Alternatively, you can specify some common colors by name. This table lists the named color options, the equivalent RGB triplets, and the hexadecimal color codes.
| Color Name | Short Name | RGB Triplet | Hexadecimal Color Code | Appearance |
|---|---|---|---|---|
"red" | "r" | [1 0 0] | "#FF0000" |
|
"green" | "g" | [0 1 0] | "#00FF00" |
|
"blue" | "b" | [0 0 1] | "#0000FF" |
|
"cyan"
| "c" | [0 1 1] | "#00FFFF" |
|
"magenta" | "m" | [1 0 1] | "#FF00FF" |
|
"yellow" | "y" | [1 1 0] | "#FFFF00" |
|
"black" | "k" | [0 0 0] | "#000000" |
|
"white" | "w" | [1 1 1] | "#FFFFFF" |
|
"none" | Not applicable | Not applicable | Not applicable | No color |
This table lists the default color palettes for plots in the light and dark themes.
| Palette | Palette Colors |
|---|---|
Before R2025a: Most plots use these colors by default. |
|
|
|
You can get the RGB triplets and hexadecimal color codes for these palettes using the orderedcolors and rgb2hex functions. For example, get the RGB triplets for the "gem" palette and convert them to hexadecimal color codes.
RGB = orderedcolors("gem");
H = rgb2hex(RGB);
Before R2023b: Get the RGB triplets using RGB =
get(groot,"FactoryAxesColorOrder").
Before R2024a: Get the hexadecimal color codes using H =
compose("#%02X%02X%02X",round(RGB*255)).
Data Types: double | char
Location and size of the figure, excluding borders, figure tools, and
title bar, specified as a four-element vector of the form [left
bottom width height].
This table describes each element in the vector.
| Element | Description |
|---|---|
left | Distance from the left edge of the primary display to the inner left edge of the window. This value can be negative on systems that have more than one monitor. If the figure is docked, then this value is relative to its container. |
bottom | Distance from the bottom edge of the primary display to the inner bottom edge of the window. This value can be negative on systems that have more than one monitor. If the figure is docked, then this value is relative to its container. |
width | Distance between the right and left inner edges of the window. |
height | Distance between the top and bottom inner edges of the window. |
All measurements are in units specified by the
Units property.
For figures that are docked into a figure container, setting the
Position property undocks the figure and sets
the WindowStyle property to
'normal'.
To position the full window, including the borders, figure tools, and
title bar, use the OuterPosition
property.
Note
The Windows® operating system enforces a minimum window width and a maximum window size. If you specify a figure size outside of those limits, the displayed figure conforms to the limits instead of the size you specified.
More About
Tips
Use the graphics root object to set default values on the root level for other types of objects. For example, set the default colormap for all future figures to the
summercolormap.To restore a property to its original MATLAB default, use theset(groot,'DefaultFigureColormap',summer)'remove'keyword.For more information on setting default values, see Default Property Values.set(groot,'DefaultFigureColormap','remove')
Version History
Introduced before R2006a