Main Content

ezplot3

(Not recommended) Easy-to-use 3-D parametric curve plotter

    ezplot3 is not recommended. Use fplot3 instead. For more information, see Version History.

    Description

    ezplot3(funx,funy,funz) plots the spatial curve defined by x = funx(u), y = funy(u), and z = funz(u) over the default interval [0,2π] for u.

    ezplot3 automatically adds a title and axis labels to the plot.

    example

    ezplot3(funx,funy,funz,uinterval) plots over the specified interval. Specify the interval as a two-element vector of the form [umin umax].

    ezplot3(___,'animate') produces an animated trace of the spatial curve. Use this option after any of the input argument combinations in the previous syntaxes.

    ezplot3(ax,___) plots into the axes specified by ax instead of the current axes. Specify the axes before any of the input argument combinations in any of the previous syntaxes.

    h = ezplot3(___) returns the plotted objects. Use h to modify properties of the plot after creating it.
    Examples

    collapse all

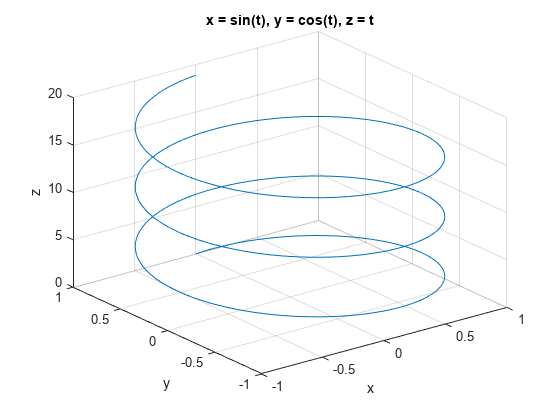
    Plot this parametric curve over the domain [0,6π].

    x=sin(t),y=cos(t),z=t

    ezplot3('sin(t)','cos(t)','t',[0,6*pi])

    Figure contains an axes object. The axes object with title x = blank sin ( t ), blank y blank = blank cos ( t ), blank z blank = blank t, xlabel x, ylabel y contains an object of type line.

    Input Arguments

    collapse all

    Parametric function for x coordinates, specified as a character vector, string scalar, or function handle to a named or anonymous function.

    Specify a function of the form x = funx(u). The function must accept a vector input argument and return a vector output argument of the same size.

    When specifying the function as a character vector or string scalar, array multiplication, division, and exponentiation are always implied. For example, x^2 is interpreted as x.^2.

    Example: 'sin(2*u)'

    When specifying the function as a function handle, use array operators instead of matrix operators for the best performance. For example, use .* (times) instead of * (mtimes).

    Example: @(u) sin(2.*u)

    Parametric function for y coordinates, specified as a character vector, string scalar, or function handle to a named or anonymous function.

    Specify a function of the form y = funy(u). The function must accept a vector input argument and return a vector output argument of the same size.

    When specifying the function as a character vector or string scalar, array multiplication, division, and exponentiation are always implied. For example, x^2 is interpreted as x.^2.

    Example: 'cos(2*u)'

    When specifying the function as a function handle, use array operators instead of matrix operators for the best performance. For example, use .* (times) instead of * (mtimes).

    Example: @(u) cos(2.*u)

    Parametric function for z coordinates, specified as a character vector, string scalar, or function handle to a named or anonymous function.

    Specify a function of the form z = funz(u). The function must accept a vector input argument and return a vector output argument of the same size.

    When specifying the function as a character vector or string scalar, array multiplication, division, and exponentiation are always implied. For example, x^2 is interpreted as x.^2.

    Example: '2*u'

    When specifying the function as a function handle, use array operators instead of matrix operators for the best performance. For example, use .* (times) instead of * (mtimes).

    Example: @(u) tan(4.*u)

    Plotting interval for u, specified as a two-element vector of the form [umin umax].

    Axes object. If you do not specify an axes object, then ezplot3 uses the current axes (gca).

    Extended Capabilities

    expand all

    Version History

    Introduced before R2006a

    collapse all