fplot3
R2026b3-D parametric curve plotter

Syntax
Description
fplot3(___, sets the line
style, marker symbol, and line color. For example, LineSpec)"-r"
specifies a red line. Use this option after any of the previous input argument
combinations.
fplot3(___, specifies line
properties using one or more name-value arguments. For example,
Name=Value)LineWidth=2 specifies a line width of 2 points.
fplot3( plots
into the axes specified by ax,___)ax instead of the
current axes. Specify the axes as the first input argument.
fp = fplot3(___)ParameterizedFunctionLine object. Use the object
to query and modify properties of a specific line. For a list of properties,
see ParameterizedFunctionLine Properties.
Examples
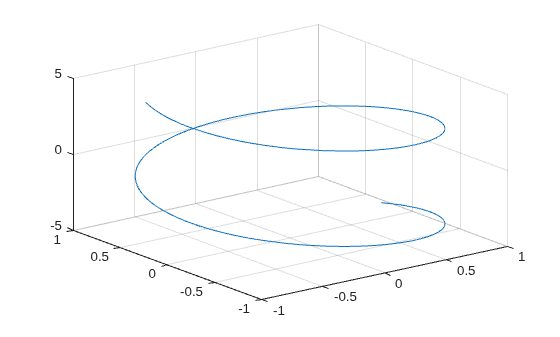
Plot the 3-D parametric line
over the default parameter range [-5 5].
xt = @(t) sin(t);
yt = @(t) cos(t);
zt = @(t) t;
fplot3(xt,yt,zt)
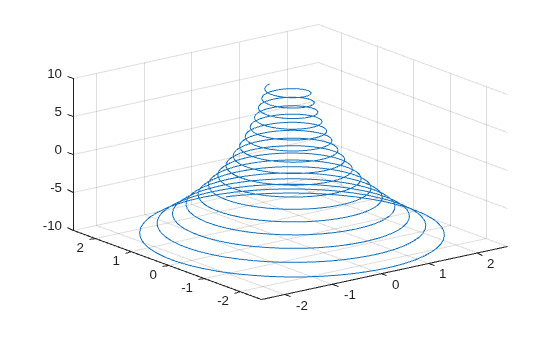
Plot the parametric line
over the parameter range [-10 10] by specifying the fourth input argument of fplot3.
xt = @(t) exp(-t/10).*sin(5*t);
yt = @(t) exp(-t/10).*cos(5*t);
zt = @(t) t;
fplot3(xt,yt,zt,[-10 10])
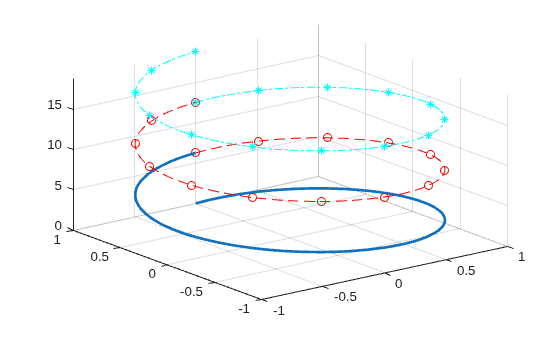
Plot the same 3-D parametric curve three times over different intervals of the parameter. For the first interval, use a line width of 2 points. For the second, specify a dashed red line style with circle markers. For the third, specify a cyan, dash-dotted line style with asterisk markers.
fplot3(@(t)sin(t), @(t)cos(t), @(t)t, [0 2*pi], LineWidth=2)
hold on
fplot3(@(t)sin(t), @(t)cos(t), @(t)t, [2*pi 4*pi], "--or")
fplot3(@(t)sin(t), @(t)cos(t), @(t)t, [4*pi 6*pi], "-.*c")
hold off
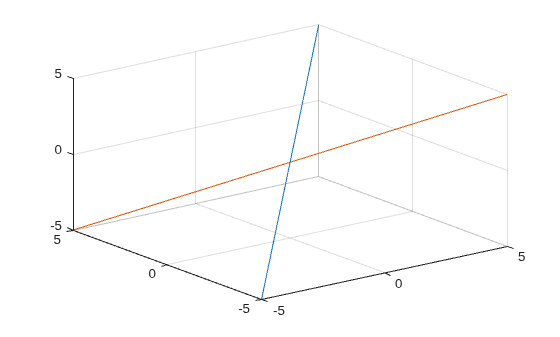
Plot multiple lines in the same axes using hold on.
fplot3(@(t)t, @(t)t, @(t)t)
hold on
fplot3(@(t)-t, @(t)t, @(t)-t)
hold off
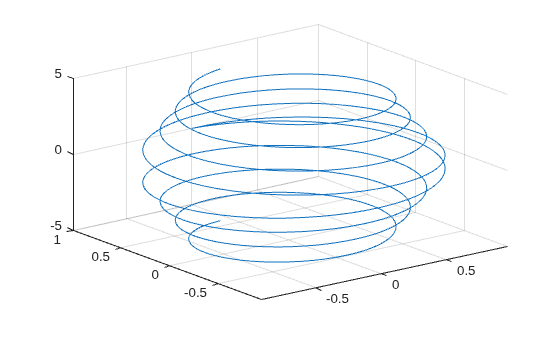
Plot the parametric line
Assign the parameterized function line object to a variable.
xt = @(t)exp(-abs(t)/10).*sin(5*abs(t));
yt = @(t)exp(-abs(t)/10).*cos(5*abs(t));
zt = @(t)t;
fp = fplot3(xt,yt,zt)
fp =
  ParameterizedFunctionLine with properties:

    XFunction: @(t)exp(-abs(t)/10).*sin(5*abs(t))
    YFunction: @(t)exp(-abs(t)/10).*cos(5*abs(t))
    ZFunction: @(t)t
        Color: [0.0660 0.4430 0.7450]
    LineStyle: '-'
    LineWidth: 0.5000

  Show all properties
Change the range of parameter values to [-10 10] and change the line color to red.
fp.TRange = [-10 10];
fp.Color = 'r';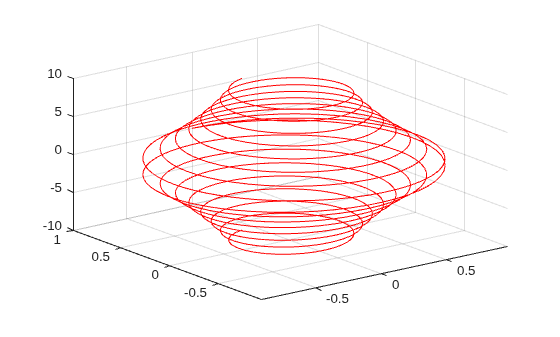
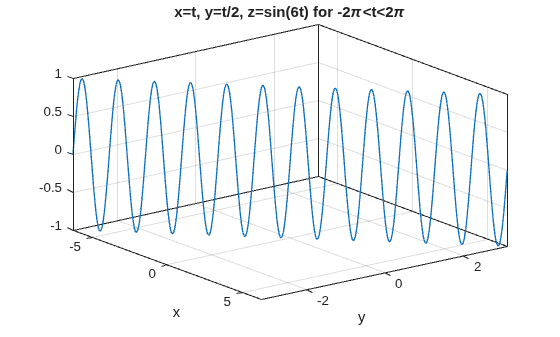
For values in the range to , plot the parametric line
Add a title, x-axis label, and y-axis label. Additionally, change the view of the axes and display the axes box outline.
xt = @(t)t;
yt = @(t)t/2;
zt = @(t)sin(6*t);
fplot3(xt,yt,zt,[-2*pi 2*pi],MeshDensity=30,LineWidth=1);

title("x=t, y=t/2, z=sin(6t) for -2\pi<t<2\pi")
xlabel("x");
ylabel("y");
view(52.5,30)
box on
Access the axes object using gca. Specify the x-axis tick values and associated labels using the XTick and XTickLabel properties of the axes object. Similarly, specify the y-axis tick values and associated labels.
ax = gca;
ax.XTick = -2*pi:pi/2:2*pi;
ax.XTickLabel = {"-2\pi","-3\pi/2","-\pi","-\pi/2","0", ...
    "\pi/2","\pi","3\pi/2","2\pi"};

ax.YTick = -pi:pi/2:pi;
ax.YTickLabel = {"-\pi","-\pi/2","0","\pi/2","\pi"};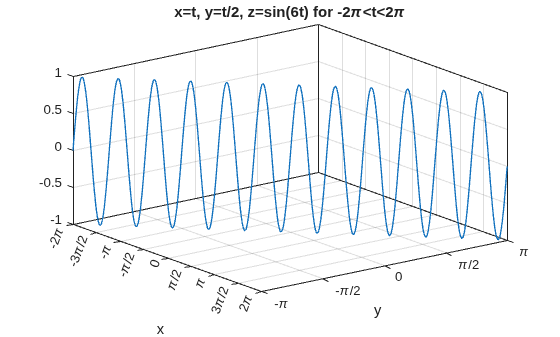
Input Arguments
Parametric function for x coordinates, specified as a function handle to a named or anonymous function.
Specify a function of the form x = funx(t).
The function must accept a vector input argument and return a vector
output argument of the same size. Use array operators instead of matrix
operators for the best performance. For example, use .* (times)
instead of * (mtimes).
Example: funx = @(t) sin(2*t);
Parametric function for y coordinates, specified as a function handle to a named or anonymous function.
Specify a function of the form y = funy(t).
The function must accept a vector input argument and return a vector
output argument of the same size. Use array operators instead of matrix
operators for the best performance. For example, use .* (times)
instead of * (mtimes).
Example: funy = @(t) cos(2*t);
Parametric function for z coordinates, specified as a function handle to a named or anonymous function.
Specify a function of the form z = funz(t).
The function must accept a vector input argument and return a vector
output argument of the same size. Use array operators instead of matrix
operators for the best performance. For example, use .* (times)
instead of * (mtimes).
Example: funz = @(t) t;
Interval for parameter t, specified as a
two-element vector of the form [tmin tmax].
Axes object. If you do not specify an axes object, then fplot3 uses
the current axes (gca).
Line style, marker, and color, specified as a string scalar or character vector containing symbols. The symbols can appear in any order. You do not need to specify all three characteristics (line style, marker, and color). For example, if you omit the line style and specify the marker, then the plot shows only the marker and no line.
Example: "--or" is a red dashed line with circle markers.
| Line Style | Description | Resulting Line |
|---|---|---|
"-" | Solid line |
|
"--" | Dashed line |
|
":" | Dotted line |
|
"-." | Dash-dotted line |
|


| Marker | Description | Resulting Marker |
|---|---|---|
"o" | Circle |
|
"+" | Plus sign |
|
"*" | Asterisk |
|
"." | Point |
|
"x" | Cross |
|
"_" | Horizontal line |
|
"|" | Vertical line |
|
"square" | Square |
|
"diamond" | Diamond |
|
"^" | Upward-pointing triangle |
|
"v" | Downward-pointing triangle |
|
">" | Right-pointing triangle |
|
"<" | Left-pointing triangle |
|
"pentagram" | Pentagram |
|
"hexagram" | Hexagram |
|


| Color Name | Short Name | RGB Triplet | Appearance |
|---|---|---|---|
"red" | "r" | [1 0 0] |
|
"green" | "g" | [0 1 0] |
|
"blue" | "b" | [0 0 1] |
|
"cyan"
| "c" | [0 1 1] |
|
"magenta" | "m" | [1 0 1] |
|
"yellow" | "y" | [1 1 0] |
|
"black" | "k" | [0 0 0] |
|
"white" | "w" | [1 1 1] |
|


Name-Value Arguments
Specify optional pairs of arguments as
Name1=Value1,...,NameN=ValueN, where Name is
the argument name and Value is the corresponding value.
Name-value arguments must appear after other arguments, but the order of the
pairs does not matter.
Example: Marker="o",MarkerFaceColor="red"
The properties listed here are only a subset. For a complete list, see ParameterizedFunctionLine Properties.
Alternatively, you can specify some common colors by name. This table lists the named color options, the equivalent RGB triplets, and the hexadecimal color codes.
| Color Name | Short Name | RGB Triplet | Hexadecimal Color Code | Appearance |
|---|---|---|---|---|
"red" | "r" | [1 0 0] | "#FF0000" |
|
"green" | "g" | [0 1 0] | "#00FF00" |
|
"blue" | "b" | [0 0 1] | "#0000FF" |
|
"cyan"
| "c" | [0 1 1] | "#00FFFF" |
|
"magenta" | "m" | [1 0 1] | "#FF00FF" |
|
"yellow" | "y" | [1 1 0] | "#FFFF00" |
|
"black" | "k" | [0 0 0] | "#000000" |
|
"white" | "w" | [1 1 1] | "#FFFFFF" |
|
This table lists the default color palettes for plots in the light and dark themes.
| Palette | Palette Colors |
|---|---|
Before R2025a: Most plots use these colors by default. |
|
|
|


You can get the RGB triplets and hexadecimal color codes for these palettes using the orderedcolors and rgb2hex functions. For example, get the RGB triplets for the "gem" palette and convert them to hexadecimal color codes.
RGB = orderedcolors("gem");
H = rgb2hex(RGB);
Before R2024a: Get the hexadecimal color codes using
H = compose("#%02X%02X%02X",round(RGB*255)).
Before R2023b: Get the RGB triplets using RGB =
get(groot,"FactoryAxesColorOrder").
Example: "blue"
Example: [0
0 1]
Example: "#0000FF"
Line style, specified as one of the options listed in this table.
| Line Style | Description | Resulting Line |
|---|---|---|
"-" | Solid line |
|
"--" | Dashed line |
|
":" | Dotted line |
|
"-." | Dash-dotted line |
|
"none" | No line | No line |
Marker symbol, specified as one of the values listed in this table. By default, the object does not display markers. Specifying a marker symbol adds markers at each data point or vertex.
| Marker | Description | Resulting Marker |
|---|---|---|
"o" | Circle |
|
"+" | Plus sign |
|
"*" | Asterisk |
|
"." | Point |
|
"x" | Cross |
|
"_" | Horizontal line |
|
"|" | Vertical line |
|
"square" | Square |
|
"diamond" | Diamond |
|
"^" | Upward-pointing triangle |
|
"v" | Downward-pointing triangle |
|
">" | Right-pointing triangle |
|
"<" | Left-pointing triangle |
|
"pentagram" | Pentagram |
|
"hexagram" | Hexagram |
|
"none" | No markers | Not applicable |
This table shows the default color palettes for plots in the light and dark themes.
You can get the RGB triplets and hexadecimal color codes for these palettes using the
orderedcolors and rgb2hex
functions. For example, get the RGB triplets for the "gem" palette
and convert them to hexadecimal color
codes.
RGB = orderedcolors("gem");
H = rgb2hex(RGB);
Before R2024a: Get the hexadecimal color codes using
H = compose("#%02X%02X%02X",round(RGB*255)).
Before R2023b: Get the RGB triplets using RGB =
get(groot,"FactoryAxesColorOrder").
| Palette | Palette Colors |
|---|---|
Before R2025a: Most plots use these colors by default. |
|
|
|
This table lists the default color palettes for plots in the light and dark themes.
| Palette | Palette Colors |
|---|---|
Before R2025a: Most plots use these colors by default. |
|
|
|
You can get the RGB triplets and hexadecimal color codes for these palettes using the orderedcolors and rgb2hex functions. For example, get the RGB triplets for the "gem" palette and convert them to hexadecimal color codes.
RGB = orderedcolors("gem");
H = rgb2hex(RGB);
Before R2024a: Get the hexadecimal color codes using
H = compose("#%02X%02X%02X",round(RGB*255)).
Before R2023b: Get the RGB triplets using RGB =
get(groot,"FactoryAxesColorOrder").
Output Arguments
Version History
Introduced in R2016a

