imshowpair
Compare differences between images
Syntax
Description
obj = imshowpair(A,B)A and B overlaid in
different color bands. To choose another type of visualization of the two images, use the
method argument. If A and B are
different sizes, imshowpair pads the smaller dimensions with zeros on the
bottom and right edges so that the two images are the same size. By default,
imshowpair scales the intensity values of A and
B independently from each other. imshowpair returns
obj, an image object.
obj = imshowpair(___,Name,Value)Name,Value pair
arguments, using any of the previous syntaxes.
Examples
Display a pair of grayscale images with two different visualization methods, "diff" and "blend".
Load an image into the workspace. Create a copy with a rotation offset applied.
A = imread("cameraman.tif");
B = imrotate(A,5,"bicubic","crop");
Display the difference of A and B.
imshowpair(A,B,"diff")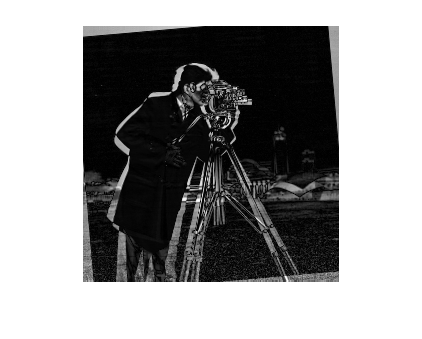
Display a blended overlay of A and B.
figure
imshowpair(A,B,"blend","Scaling","joint")

Read an image. Create a copy and apply rotation and a brightness adjustment.
A = dicomread("CT-MONO2-16-ankle.dcm");
B = imrotate(A,10,"bicubic","crop");
B = B * 0.2;
In this example, we know that the resolution of images A and B is 0.2 mm. Provide this information using two spatial referencing objects.
RA = imref2d(size(A),0.2,0.2);
RB = imref2d(size(B),0.2,0.2);
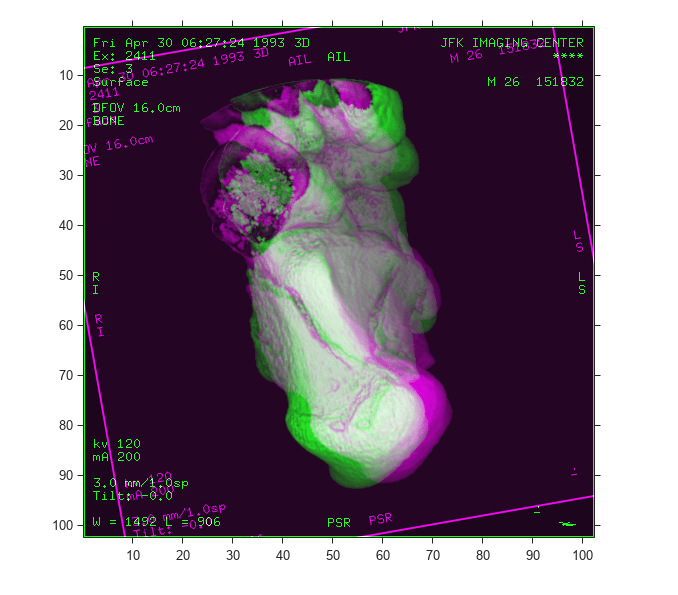
Display the images with the default method ("falsecolor") and apply brightness scaling independently to each image. Specify the axes that will be the parent of the image object created by imshowpair.
figure;
hAx = axes;
imshowpair(A,RA,B,RB,"Scaling","independent","Parent",hAx);
Input Arguments
Image to be displayed, specified as a grayscale, truecolor, or binary image.
Image to be displayed, specified as a grayscale, truecolor, or binary image.
Spatial referencing information about an input image, specified
as spatial referencing object, of class imref2d.
Spatial referencing information about an input image, specified
as spatial referencing object, of class imref2d.
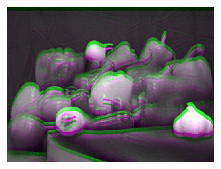
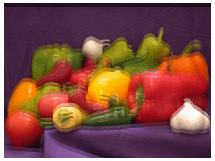
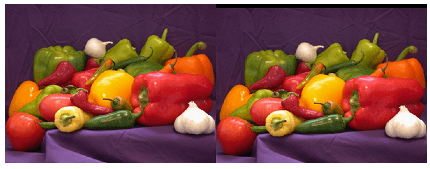
Visualization method to display combined images, specified as one of the following values. The images in the table compare the peppers image before and after applying a small vertical translation.
| Value | Description | Sample Display |
|---|---|---|
"falsecolor" | Overlay A and B in different color
bands. Gray regions indicate where the images have the same intensity. Colored
regions show where the intensities differ. Optionally specify the display colors
using the ColorChannels argument. The function converts RGB
images to grayscale before displaying them in falsecolor. |
|
"blend" | Overlay A and B using alpha blending.
The intensity of the display is the mean of the two images. |
|
"checkerboard" | Display an image with alternating rectangular regions from
A and B. |
|
"diff" | Display a difference image from A and
B. The function converts RGB images to grayscale before
calculating the difference image. |
|
"montage" | Place A and B next to each other in
the same figure. |
|

Data Types: char | string
Name-Value Arguments
Output Arguments
Tips
Use
imfuseto create composite visualizations that you can save to a file. Useimshowpairto display composite visualizations to the screen.Figure titles can appear cut off in the Live Editor. To ensure the whole title is visible, set the
PositionContraintproperty of the parent axes object to"outerposition". Update the property value after theimshowpairfunction and before thetitlefunction.If you specify the parent axes using theI = imread("peppers.png"); imshowpair(I,I) ax = gca; ax.PositionConstraint = "outerposition"; title("Peppers");
Parentname-value argument, set thePositionConstraintproperty of the specified parent axes object. For more details about axes position properties, see Control Axes Layout.
Version History
Introduced in R2012a
See Also
imfuse | imblend | imregister | imshow | imtransform | montage