plot
Plot vehicle costmap
Description
The plot function displays a vehicle costmap. The darkness
of each cell is proportional to the cost value of the cell. Cells with low cost are
bright, and cells containing obstacles with high cost are dark. Inflated areas are
displayed with a red hue, and cells outside the inflated area are displayed in
grayscale.
plot(
plots the vehicle costmap using name-value pair arguments to specify the parent axes
or to adjust the display of inflated areas.costmap,Name,Value)
Examples
Load a costmap from a parking lot. Display the costmap.
data = load('parkingLotCostmap.mat');
parkMap = data.parkingLotCostmap;
plot(parkMap)
Create a template polyshape object with the dimensions of the car.
carDims = parkMap.CollisionChecker.VehicleDimensions
carDims =
  vehicleDimensions with properties:

           Length: 4.7000
            Width: 1.8000
           Height: 1.4000
        Wheelbase: 2.8000
     RearOverhang: 1
    FrontOverhang: 0.9000
       WorldUnits: 'meters'
ro = carDims.RearOverhang;
fo = carDims.FrontOverhang;
wb = carDims.Wheelbase;
hw = carDims.Width/2;
X = [-ro,wb+fo,wb+fo,-ro];
Y = [-hw,-hw,hw,hw];
templateShape = polyshape(X',Y');
Create a function handle to move the template to a specified vehicle pose. This move function translates the polyshape s to the coordinate (x,y) and then rotates the polyshape by an angle theta about the point (x,y).
move = @(s,x,y,theta) rotate(translate(s,[x,y]), ...
    theta,[x,y]);
Move the car template to a pose.
carPose = [5,5,75];
carShape = move(templateShape,carPose(1),carPose(2),carPose(3));
Plot the car on the costmap.
hold on
plot(carShape)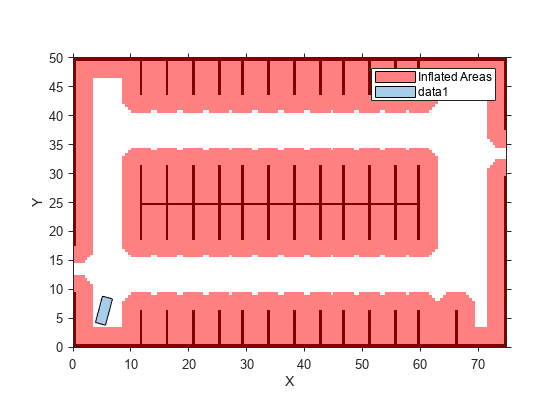
Input Arguments
Name-Value Arguments
Version History
Introduced in R2018a