confusionchart
Create confusion matrix chart for classification problem
Syntax
Description
confusionchart( creates a confusion matrix chart from true labels trueLabels,predictedLabels)trueLabels and predicted labels predictedLabels and returns a ConfusionMatrixChart object. The rows of the confusion matrix correspond to the true class and the columns correspond to the predicted class. Diagonal and off-diagonal cells correspond to correctly and incorrectly classified observations, respectively. Use cm to modify the confusion matrix chart after it is created. For a list of properties, see ConfusionMatrixChart Properties.
confusionchart( specifies class labels that appear along the x-axis and y-axis. Use this syntax if you already have a numeric confusion matrix and class labels in the workspace.m,classLabels)
confusionchart( creates the confusion chart in the figure, panel, or tab specified by parent,___)parent.
confusionchart(___, specifies additional Name,Value)ConfusionMatrixChart properties using one or more name-value pair arguments. Specify the properties after all other input arguments. For a list of properties, see ConfusionMatrixChart Properties.
cm = confusionchart(___)ConfusionMatrixChart object. Use cm to modify properties of the chart after creating it. For a list of properties, see ConfusionMatrixChart Properties.
Examples
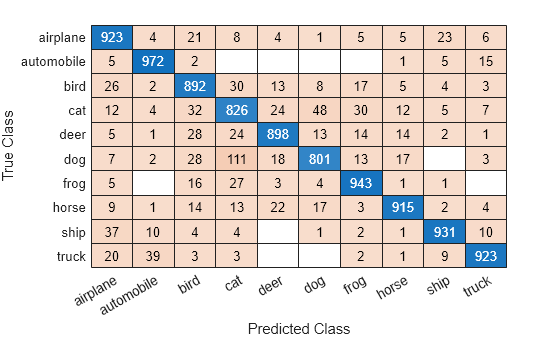
Load a sample of predicted and true labels for a classification problem. trueLabels is the true labels for an image classification problem and predictedLabels is the predictions of a convolutional neural network.
load('Cifar10Labels.mat','trueLabels','predictedLabels');
Create a confusion matrix chart.
figure
cm = confusionchart(trueLabels,predictedLabels);

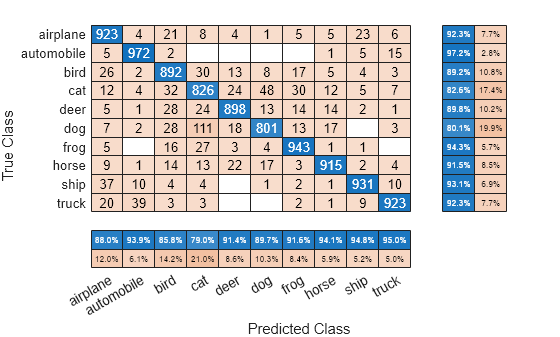
Modify the appearance and behavior of the confusion matrix chart by changing property values. Add column and row summaries and a title. A column-normalized column summary displays the number of correctly and incorrectly classified observations for each predicted class as percentages of the number of observations of the corresponding predicted class. A row-normalized row summary displays the number of correctly and incorrectly classified observations for each true class as percentages of the number of observations of the corresponding true class.
cm.ColumnSummary = 'column-normalized';
cm.RowSummary = 'row-normalized';
cm.Title = 'CIFAR-10 Confusion Matrix';

You can use confusionchart to create a confusion matrix chart from a numeric confusion matrix.
Load a sample confusion matrix m and the associated class labels classLabels.
load('Cifar10ConfusionMat.mat','m','classLabels');
m
m = 10×10

   923     4    21     8     4     1     5     5    23     6
     5   972     2     0     0     0     0     1     5    15
    26     2   892    30    13     8    17     5     4     3
    12     4    32   826    24    48    30    12     5     7
     5     1    28    24   898    13    14    14     2     1
     7     2    28   111    18   801    13    17     0     3
     5     0    16    27     3     4   943     1     1     0
     9     1    14    13    22    17     3   915     2     4
    37    10     4     4     0     1     2     1   931    10
    20    39     3     3     0     0     2     1     9   923
classLabels
classLabels = 10×1 categorical
     airplane
     automobile
     bird
     cat
     deer
     dog
     frog
     horse
     ship
     truck
Create a confusion matrix chart from the numeric confusion matrix and the class labels.
cm = confusionchart(m,classLabels);
Load a sample of predicted and true labels for a classification problem. trueLabels are the true labels for an image classification problem and predictedLabels are the predictions of a convolutional neural network. Create a confusion matrix chart with column and row summaries.
load('Cifar10Labels.mat','trueLabels','predictedLabels');
figure
cm = confusionchart(trueLabels,predictedLabels, ...
    'ColumnSummary','column-normalized', ...
    'RowSummary','row-normalized');
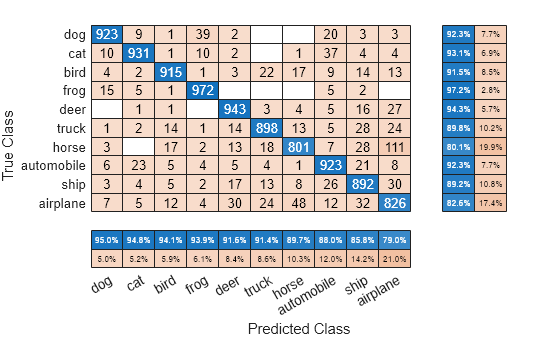
To sort the classes of the confusion matrix by class-wise recall (true positive rate), normalize the cell values across each row, that is, by the number of observations that have the same true class. Sort the classes by the corresponding diagonal cell values and reset the normalization of the cell values. The classes are now sorted such that the percentages in the blue cells in the row summaries to the right are decreasing.
cm.Normalization = 'row-normalized';
sortClasses(cm,'descending-diagonal');
cm.Normalization = 'absolute';

To sort the classes by class-wise precision (positive predictive value), normalize the cell values across each column, that is, by the number of observations that have the same predicted class. Sort the classes by the corresponding diagonal cell values and reset the normalization of the cell values. The classes are now sorted such that the percentages in the blue cells in the column summaries at the bottom are decreasing.
cm.Normalization = 'column-normalized';
sortClasses(cm,'descending-diagonal');
cm.Normalization = 'absolute';
Input Arguments
Name-Value Arguments
Output Arguments
Limitations
MATLAB® code generation is not supported for
ConfusionMatrixChartobjects.
More About
Tips
If you have one-hot (one-of-N) data, use
onehotdecodeto prepare your data for use withconfusionchart. For example, suppose you have true labelstargetsand predicted labelsoutputs, with observations in columns. You can create a confusion matrix chart usingnumClasses = size(targets,1); trueLabels = onehotdecode(targets,1:numClasses,1); predictedLabels = onehotdecode(outputs,1:numClasses,1); confusionchart(trueLabels,predictedLabels)
If you have Statistics and Machine Learning Toolbox™, you can create a confusion matrix chart for tall arrays. For details, see
confusionchart(Statistics and Machine Learning Toolbox) and Confusion Matrix for Classification Using Tall Arrays (Statistics and Machine Learning Toolbox).