spectralSlope
Spectral slope for audio signals and auditory spectrograms
Description
slope = spectralSlope(x,f,Name=Value)
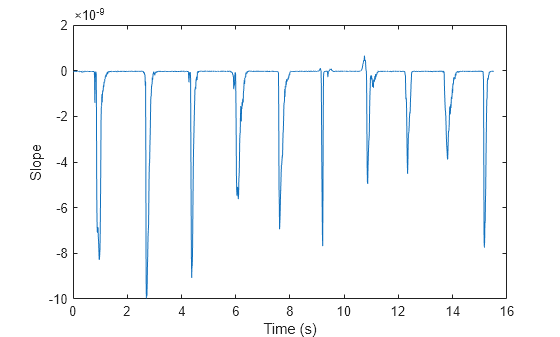
spectralSlope(___) with no output arguments plots the
spectral slope. You can specify an input combination from any of the previous syntaxes.
If the input is in the time domain, the spectral slope is plotted against time.
If the input is in the frequency domain, the spectral slope is plotted against frame number.
Examples
Input Arguments
Name-Value Arguments
Output Arguments
Algorithms
The spectral slope is calculated as described in [1]:
where
fk is the frequency in Hz corresponding to bin k.
μf is the mean frequency.
sk is the spectral value at bin k.
μs is the mean spectral value.
b1 and b2 are the band edges, in bins, over which to calculate the spectral slope.
References
[1] Lerch, Alexander. An Introduction to Audio Content Analysis Applications in Signal Processing and Music Informatics. Piscataway, NJ: IEEE Press, 2012.
Extended Capabilities
Version History
Introduced in R2019a


