
- 957 (All time)
- 17 (Last 30 days)
- 5.0 / 5
- Community
-
14 Oct 2023

PeterRochford/SkillMetricsToolbox
A collection of functions for calculating the skill of model predictions against observations.
This toolbox contains a collection of Matlab functions for calculating the skill of model predictions against observations. Its primary value is in producing target and Taylor diagrams.Evaluation of
- 5.9K (All time)
- 16 (Last 30 days)
- 4.9 / 5
- Community
-
20 Mar 2024

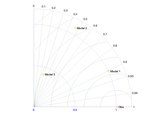
Plot a Taylor Diagram
Plot a Taylor diagram from statistics values given by STDs (standard deviations), RMSs (centered root mean square difference) and CORs (correlation)Ref: K. TaylorSummarizing multiple aspects of model
- 14.2K (All time)
- 40 (Last 30 days)
- 4.1 / 5
- Community
-
10 Feb 2010
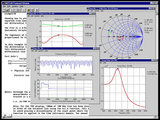
Calculate (and plot) skill statistics for model validation
diagrams like Taylor diagrams (Taylor 2001, J Geophys Res Atmos 106:7183-7192) or target diagrams (Jolliff et al. 2009, J Mar Syst 76:64-82). The example below illustrates how to create these diagrams in
- 15 (All time)
- 1 (Last 30 days)
- -- / 5
- Community
-
15 Aug 2024

V-n Diagram for Fixed wing Aircraft
This app lets the user to plot the V-N diagram for a Fixed wing aircraft at sea level conditions. This also calculates the effect of vertical gust.
- 4.3K (All time)
- 65 (Last 30 days)
- 4.5 / 5
- Community
-
26 Oct 2020

Taylor series in the complex plane
2D plot of complex functions using color wheel, and animates their Taylor series convergence
Running the code taylor will show you several examples of visualizing functions on the complex plane, and animating their n-term Taylor series as n increased from 1 to say 20. This provides an
- 1.4K (All time)
- 2 (Last 30 days)
- 5.0 / 5
- Community
-
14 Apr 2016

This program computes the power diagram for a given set of weighted points.
A power diagram is a form of generalized Voronoi diagram, generated by a set of points and their corresponding weights. This program computes the power diagram for a given set of weighted points by
- 1.7K (All time)
- 4 (Last 30 days)
- 4.6 / 5
- Community
-
24 Mar 2014

Bifurcation diagrams for continuous-time dynamical systems based on analysis of local maxima and minima
Most bifurcation diagrams for continuous-time dynamical systems are based on analysis of local maxima. In fact we must also consider the minima. We present a program applied to the Rössler system
- 2.2K (All time)
- 11 (Last 30 days)
- 5.0 / 5
- Community
-
4 Jul 2019

Plot flows from sources to sinks and relationships between categories.
- 1.3K (All time)
- 14 (Last 30 days)
- 4.7 / 5
- Community
-
12 Apr 2018

biChordChart (bidirectional chord diagram | 有向弦图)
bidirectional/directed/self-loop/self-links chord diagram 有向弦图
bidirectional chord diagram 有向弦图Basic usagedataMat=randi([0,8],[6,6
- 629 (All time)
- 12 (Last 30 days)
- 5.0 / 5
- Community
-
14 Apr 2026

Taylor Maccoll Solution for Supersonic Flow over a Cone
Taylor Maccoll Solution for Supersonic Flow over a Cone. The program solves for the entire flow field over the cone.
The following code provides a solution to solve the Taylor Maccoll equation for supersonic flow over a cone. The user needs to specify the freestream Mach number(M), the half cone angle (theta_cone
- 1.7K (All time)
- 41 (Last 30 days)
- 5.0 / 5
- Community
-
18 Dec 2020

Determines the appropriate coefficients for a point operator by minimizing the Taylor Series Error
Based on the concept of the Taylor Table given in Fundamentals of Computational Fluid Dynamics by Lomax, Pulliam, and Zingg. Given the terms of the point operator, "TaylorTable" will determine the
- 540 (All time)
- 1 (Last 30 days)
- 5.0 / 5
- Community
-
3 Jan 2011

Generates Moody Diagram
MOODY(UNITS,PAPER,NAME) generates a four axis, publication quality Moody diagram as a PAPER size portable document format file NAME with UNITS. Default units are IMPERIAL. If units are SI, the
- 20.2K (All time)
- 12 (Last 30 days)
- 4.6 / 5
- Community
-
3 Nov 2021

Program computes and shows phasor diagram and time graph which is measured in SimPowerSystems.
This submission contains block for measuring voltages and currents in your SimPowerSystems model, m-file for computing desired values and gui model for showing phasor diagram. It also contains simple
- 2.3K (All time)
- 7 (Last 30 days)
- 5.0 / 5
- Community
-
15 May 2014

Two step Taylor Galerkin algorithm
The two step Taylor Galerkin algorithm applied to nonlinear structural dynamics
dominated problems. Here a conservative explicit two step Taylor Galerkin algorithm formulated in terms of velocity is proposed for nonlinear impact dynamics with hyperelastic materials.This work was accepted
- 2.3K (All time)
- 3 (Last 30 days)
- 5.0 / 5
- Community
-
20 Jun 2007
Taylor Table and Finite Difference Aproximations
Determines Taylor coefficients for a finite differencing scheme with constant spacing.
you're looking for! T optional output matrix showing the Taylor Table coefficents errOrder - lowest order of higher order terms (order of accuracy, ie. H.O.T. = O(dx^2
- 628 (All time)
- 2 (Last 30 days)
- 5.0 / 5
- Community
-
6 Nov 2010

Diagrams of Thermodynamic State of Water
Plot T,s; h,s or log p,h-Diagrams of Water within MATLAB
You can plot your own T,s; h,s or log p,h-Diagrams of water in MATLAB with the function thermo_diagram_plot.m.The function makes use of Magnus Holmgrens work available at
- 4.8K (All time)
- 4 (Last 30 days)
- 4.8 / 5
- Community
-
16 Mar 2010

Optimal finite-difference coefficients for staggered grid finite-differences
Compute finite-difference coefficients to approximate first-order derivatives optimally
f(x-1/2dx)]/dx.The coefficients for longer finite-difference stencils are typically (at an introductory level) derived from Taylor series expansion, which provides a 'spectrally' accurate derivative up to a limited
- 240 (All time)
- 3 (Last 30 days)
- 5.0 / 5
- Community
-
15 May 2018

Matrix exponential times a vector.
Computing the matrix exponential times a vector without explicitly computing the matrix exponential.
- 1.4K (All time)
- 3 (Last 30 days)
- 5.0 / 5
- Community
-
30 Nov 2010
Circle Bounded Voronoi Diagram
Compute individual Voronoi cell area of 2D point sets bounded in a unit circle
- 1.2K (All time)
- 4 (Last 30 days)
- 5.0 / 5
- Community
-
9 Feb 2011

6DoF robot simulink diagram for simulation
6DoF robot simulink diagram for simulation
Simulink diagram that simulates a 6DoF manipulator that has been used in surgical robotics.The diagram solves the constrained movements of a manipulator that holds a surgical instrument that is
- 3K (All time)
- 15 (Last 30 days)
- 5.0 / 5
- Community
-
15 Dec 2015

This application deals with the asymptotic bode diagrams of trasfer function W(s)
This application deals with the asymptotic bode diagrams of trasfer function W(s) defined by numerator and denominatorExample:num=rand(1,5);den=rand(1,6);bode_asymptotic(num,den);
- 10.8K (All time)
- 32 (Last 30 days)
- 5.0 / 5
- Community
-
31 Mar 2016
draws a t-s diagram for given temperature and salinity data
t-s diagram is very useful for determining water mass property in physical oceanography. This program helps to plot the T-S diagram with density contours in the background. it used external code
- 7.4K (All time)
- 13 (Last 30 days)
- 5.0 / 5
- Community
-
16 Apr 2009

This function produces a hasse diagram.
- 541 (All time)
- 1 (Last 30 days)
- 5.0 / 5
- Community
-
30 May 2010
- 8.3K (All time)
- 11 (Last 30 days)
- 5.0 / 5
- Community
-
12 Feb 2010

Systems-Level Microgrid Simulation from Simple One-Line Diagram
Example simple Microgrid with library of PQ-based Renewables and Diesel GenSets.
": https://www.mathworks.com/videos/series/microgrid-system-development-and-analysis.htmlSimscape Power Systems can be used to schematically represent a one-line microgrid diagram using blocks that represent different distributed energy resources (DERs). The DERs in this example include
- 10K (All time)
- 44 (Last 30 days)
- 5.0 / 5
- Community
-
15 May 2018

- 8.1K (All time)
- 3 (Last 30 days)
- 4.7 / 5
- Community
-
16 Nov 2009

- 34.9K (All time)
- 20 (Last 30 days)
- 4.5 / 5
- Community
-
9 Feb 2004

Returns 2D clipped Voronoi Diagram of a cloud of points. Valid for all kinds of domains, holes...
- 1.3K (All time)
- 4 (Last 30 days)
- 5.0 / 5
- Community
-
20 Jul 2010
Bifurcation diagrams for continuous-time dynamical systems based on analysis of local maxima and minima.
Most bifurcation diagrams for continuous-time dynamical systems are based on analysis of local maxima. In fact we must also consider the minima. We present a program applied to the Rössler system
- 244 (All time)
- 2 (Last 30 days)
- 5.0 / 5
- Community
-
4 Jul 2019

Differential MPSK over Rayleigh fading channels
Differential MPSK over correlated Rayleigh fading channels
- 674 (All time)
- 2 (Last 30 days)
- 5.0 / 5
- Community
-
15 Aug 2014

- 2K (All time)
- 3 (Last 30 days)
- 5.0 / 5
- Community
-
18 Oct 2010

Light-matter interaction energy diagrams
Allows you to create simple light-matter interaction energy diagrams. Include your quantum states and photon couplings between states.
Allows you to create well-defined and simple light-matter interaction energy diagrams. Include quantum states and photon energies (couplings) between states. Ideal for non-linear optics and
- 91 (All time)
- 5 (Last 30 days)
- 5.0 / 5
- Community
-
15 Mar 2021

- 11.5K (All time)
- 4 (Last 30 days)
- 5.0 / 5
- Community
-
11 Dec 2016
Color Tools for MATLAB is an experimental collection of MATLAB functions related to color science computation and visualization.
- 1.1K (All time)
- 4 (Last 30 days)
- 5.0 / 5
- Community
-
27 Jan 2023

Create Venn Diagrams from Set Expressions
Takes in a logically valid expression on 3 sets and outputs a Venn diagram with the appropriate region colored
Given a logical expression consisting of three sets: A, B and C and the usual operators & (AND), | (OR), ~(NOT) and - (SUBTRACTION), this code will output a Venn diagram with the appropriate
- 342 (All time)
- 3 (Last 30 days)
- 5.0 / 5
- Community
-
29 Jan 2020

Applications of Chaos and Nonlinear Dynamics in Engineering - Vol. 1
Lynch files to accompany the book.
- 4.5K (All time)
- 3 (Last 30 days)
- 5.0 / 5
- Community
-
1 Jul 2013

The Matlab code of blind deconvolution based on criterion defined by envelope spectrum
- 215 (All time)
- 2 (Last 30 days)
- 5.0 / 5
- Community
-
17 Jun 2021

Compute ordinary and partial derivatives of arbitrary order.
arbitrary number of unknowns. AutoDiff also provides a set of utilities, including differential operators, like Laplacian and curl, Taylor expansion of explicit expressions and solutions of ODEs, and
- 1.4K (All time)
- 2 (Last 30 days)
- 5.0 / 5
- Community
-
31 Mar 2017

This function SFBM.m calculates and draw the shear force and bending moment diagrams.
%% Shear Force & Bending Moment Examples% This program calculates the shear force and bending moment profiles, % draws the free body, shear force and bending moment diagrams of the %
- 12.7K (All time)
- 57 (Last 30 days)
- 4.8 / 5
- Community
-
19 Sep 2024
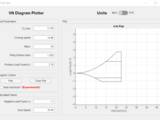
Plots V-N diagrams for fixed wing aircraft
V-N diagram plotter for fixed wing aircrafts at low speeds and load factors.---------------------------------------------24-10-2020 Ver. 1.0 -Initial Release26-10-2020 Ver. 1.1 -Cleaned code and
- 1.2K (All time)
- 33 (Last 30 days)
- -- / 5
- Community
-
8 Nov 2020

- 22.2K (All time)
- 11 (Last 30 days)
- 4.7 / 5
- Community
-
21 Nov 2002
find_in_models: Search the entire block diagram hierarchy
A wrapper for find_system which searches inside model references
itself, can also close block diagrams after searching them. This ensures scalability when searching large hierarchies. The usage is very similar to that of find_system itself except that a model name or
- 2.7K (All time)
- 2 (Last 30 days)
- 3.4 / 5
- Community
-
1 Sep 2016

Create UML style Sequence Diagrams
Create UML Style sequence diagrams with MATLAB. The API allows you to define differnt types of transitions between nodes, and everything else is managed automatically.
- 3.3K (All time)
- 2 (Last 30 days)
- 3.8 / 5
- Community
-
1 Sep 2016

Draws a venn diagram for two or three sets with proportional areas.
%% function error = vennX( data, resolution )%% vennX - draws an area proportional venn diagram%% Draws a venn diagram (either two or three set) using% circles, where the area of each region is
- 7.9K (All time)
- 4 (Last 30 days)
- 4.3 / 5
- Community
-
28 Oct 2004

Calculate isobaric V-L equilibrium data for binary system for real mixture and van Laar equations
- 1.6K (All time)
- 3 (Last 30 days)
- 5.0 / 5
- Community
-
1 Nov 2009

Asymptotic Bode diagrams (extended)
MATLAB script to plot asymptotic bode diagrams, including those of improper systems and pure integrators
, zpk, ss or a symbolic expression representing a rational function. * The model can be improper, e.g., calling asymp_bode(tf([1 1],[0 1])) will plot the expected bode diagram.* Time delays, non
- 1.8K (All time)
- 30 (Last 30 days)
- 4.5 / 5
- Community
-
11 Nov 2021

differential steering control by single genetic PID
A framework for a differential steering vehicle controlled by a PID system tuned with a genetic algo
- 4.6K (All time)
- 6 (Last 30 days)
- 5.0 / 5
- Community
-
16 Apr 2007

Numerical Solutions to the Taylor-Maccoll Equation are obtained using 4th order Runge-Kutta Method for a supersonic flow over a cone.
The files provides the numerical procedures used to solve oblique shock relation and Taylor-Maccoll equation. 4th-order Runge-Kutta numerical scheme is employed to implicitly solve the Taylor
- 980 (All time)
- 15 (Last 30 days)
- 5.0 / 5
- Community
-
19 Jun 2023

Level Diagrams for multiobjective decision making and Design Concepts Comparison
A tool to draw Leveldiagrams, with utilities for decision making and design concepts comparison.
to keepthis version as a testimony, but it will not longer be updated. I invite you to chek the new (& COOL!) complete rebuilt of the interactive tool for Level diagrams
- 880 (All time)
- 2 (Last 30 days)
- 5.0 / 5
- Community
-
22 Nov 2017

chordChart (chord diagram | 弦图)
plot beautiful chord chart 好看的弦图绘制
plot beautiful chord chart好看的弦图绘制详细使用请看demo含有自连接的弦图请见 https://www.mathworks.com/matlabcentral/fileexchange/121043-bichordchart-bidirectional-chord-diagramFor self-loop chord diagram, see
- 1.2K (All time)
- 12 (Last 30 days)
- 5.0 / 5
- Community
-
14 Apr 2026

Sequential Vector plot. Vector components x, y are required. User can define the initial position.
- 1.7K (All time)
- 3 (Last 30 days)
- 5.0 / 5
- Community
-
13 Jun 2011

Collection of interactive demos illustrating fundamental topics in calculus.
, the following topics are covered:* Newton's Method* Mean Value Theorem* Rational Function Analysis* Steepest Descent* Derivative and Tangent* Polynomial Interpolation* Taylor Approximation* Tangent
- 1.3K (All time)
- 3 (Last 30 days)
- 5.0 / 5
- Community
-
9 Jan 2020

Block diagram Optimization Tool
BOT optimizes the layout of the current Simulink block diagram.Blocks and lines are resized and moved until their vertices satisfy a 5 pixel grid.You can define safety zones around blocks and line
- 3.3K (All time)
- 3 (Last 30 days)
- 4.5 / 5
- Community
-
24 Feb 2014

Polytope bounded Voronoi diagram in 2D and 3D
The function cacluates arbitrary polytope bounded Voronoi diagram in 2D/3D
Polytope-bounded-Voronoi-diagramThis is a MATLAB scriptWhat is this for?The function calculates Voronoi diagram with the finite set of points that are bounded by an arbitrary polytope. The Voronoi
- 2.1K (All time)
- 4 (Last 30 days)
- 4.5 / 5
- Community
-
14 Aug 2023

Framework for differential steering vehicle
A framework for a differential steering vehicle controlled by a PID system tuned with a genetic algo
- 2.3K (All time)
- 1 (Last 30 days)
- 4.8 / 5
- Community
-
12 Apr 2007

Polytope bounded order-2 Voronoi diagram in 2D/3D
The function creates arbitrary polytope bounded order-2 Voronoi diagram in 2D/3D
Polytope-bounded-order2-Voronoi-diagramThis program creates order-2 Voronoi diagram with set of points in 2D/3D polygon. The function uses my previous program "polybnd_voronoi.m" that computes
- 653 (All time)
- 3 (Last 30 days)
- 4.5 / 5
- Community
-
3 Jun 2020

Creates a Sankey containing mulitple blocks
The code is created largely based on the alluvial diagram (https://nl.mathworks.com/matlabcentral/fileexchange/66746-alluvial-flow-diagram). It improves the alluvial diagram in two respects:1. It can
- 1.7K (All time)
- 13 (Last 30 days)
- 4.1 / 5
- Community
-
22 May 2020

- 12.2K (All time)
- 3 (Last 30 days)
- 4.5 / 5
- Community
-
6 Mar 2003

Discrete Element Method Laboratory
diagrams][uml_link] and their codes in HTML files, located inside the folder [*html*][html_folder_link].These files can be browsed on their [Wiki page][wiki_html_link].Tutorials explaining all the options of the
- 534 (All time)
- 2 (Last 30 days)
- 5.0 / 5
- Community
-
21 Feb 2024