Help! Projectile Motion Plotting
Show older comments
clear all
close all
clc
format bank
%---------------------------------------------------------------
h = input('Hight is: ');
v0x = 10;
g = 9.8;
%---------------------------------------------------------------
t_max = sqrt(2*h/g)
x_max = v0x*g
%---------------------------------------------------------------
grid on
axis equal;
xlim([0, 100]);
ylim([0, 100]);
xlabel('x_max)');
ylabel('h');
title ('Graph h, x_max');
I have done most of the code but I dont understand how can I have the same graph look as the photo below (just the ball's motion).
Please help me
4 Comments
Geoff Hayes
on 9 Apr 2020
I think that you are missing one or more equations to determine the height at time t and the horizontal displacement at time t. Do you have those?
Dark Shadow
on 9 Apr 2020
Edited: Dark Shadow
on 9 Apr 2020
the cyclist
on 9 Apr 2020
Edited: the cyclist
on 9 Apr 2020
When you say, "that is all I have" you fail to mention this very detailed response you got the previous time you asked very nearly the same question -- just 6 hours ago.
You also asked a different question (also multiple times). And, again, you seem to not be showing any evidence of using any of the information you are receiving.
I think you need to find some help outside of this forum, from your instructor or a tutor.
Dark Shadow
on 9 Apr 2020
Accepted Answer
Optics Wizard
on 9 Apr 2020
1 vote
Quick sidenote in response to back-and-forth between OP (Dark Shadow) and the cyclist:
Yes, this question is greater in scope than is altogether appropriate for this message board, and given the previous in-depth response it is reasonable that "the cyclist" thought this post was a bit inappropriate. However, given the difficult quarantine situations impacting several students' education, and that quarantine is driving me insane that I need a bit of a distraction, I don't mind giving an quick physics lesson.
So let's go! Quick physics-coding lesson:
You need to figure out what equations are necessary before you get to coding. For instance:
Yay! We are almost there!
Now what do we know? (this is not for coding, but just to understand the physics process)
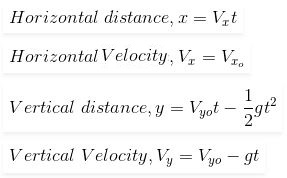
Starting height (y-axis): h0 = y0
x-axis velocity: v0x = vx0 = vx (no time dependence!)
y-axis velocity: vy = -gt (remember, vy0=0 because the projectile is shot horizontally, no vertical component)
The 'y' equation above is actually wrong. It should be y=y0+vyo-(1/2)*(gt^2) (gotta consider the initial condition)
So let's put it together!
y = h0 - (1/2)(gt^2)
What do we want to find? Time t when the object hits the ground: y = 0
0 = h0 - (1/2)(gt^2)
Then solve for t!
t = sqrt(2*h/g) = t_max (that's where the equation you had comes from!)
So what's the max distance?
x = vx*t_max = x_max
Yaaayyy!!!
So, let's plot it. The x_max and t_max equations are good, but they cannot themselves be used to plot the entire path. I'm going to write psuedo-code (not going to test it myself, just to teach the concept) so you'll have to do a bit of the work to implement it, but I'll get you most of the way there.
This is a parametric equation problem: x(t) and y(t)
t = linspace(0,t_max,100); % Set time domain from 0 to t_max
x = vx0*t; % Determine path of object in x
y = h0 - (1/2)(g*t^2); % Determine path of object in y
fprintf('The max distance is: %f \n\n', x_max);
fprintf('The max time is: %f \n\n', t_max);
plot(x,y)
fprintf('We did it! Yaaayyy!!!!);
Hope that helps!
More Answers (0)
Categories
Find more on Graphics Performance in Help Center and File Exchange
Products
Community Treasure Hunt
Find the treasures in MATLAB Central and discover how the community can help you!
Start Hunting!