How do I plot a 2D powermap for SignalStrength calculated bwtween two plot in a graph using imagesc
Show older comments
I have one plot called a subscriber and 5 plots called small cells. I have calculated manually (without using inbuilt matlab functions) the receiver signal strength. I need to plot a 2D imagesc showing the signal strengths in color and use the map to show where these five small cells could be located.
Answers (1)
Jacob Halbrooks
on 3 Apr 2020
0 votes
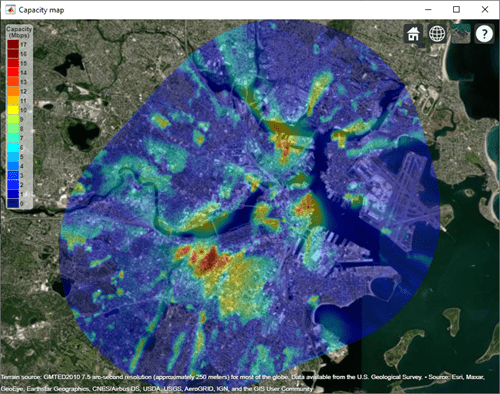
A new feature is available in R2020a to support importing and visualizing propagation data like this. The feature is available in Communications Toolbox and Antenna Toolbox and supports table-based files or data which contains latitude, longitude, and corresponding values like signal strength. You can learn about the feature here, and below is an example contour map that you can create with it:
Categories
Find more on Geographic Plots in Help Center and File Exchange
on 9 Jul 2019
on 3 Apr 2020
Community Treasure Hunt
Find the treasures in MATLAB Central and discover how the community can help you!
Start Hunting!